I am Article Layout

Now Reading: Barometer: Day trader salvos won't dent stocks' attractions

Select your investor profile:

This content is only for the selected type of investor.

Investisseurs particuliers?

Barometer of financial markets February investment outlook

February 2021
Marketing Material

Barometer: Day trader salvos won't dent stocks' attractions

The targeting of hedge funds by an army of non-professional investors doesn't overshadow equities' improving prospects.

01

Asset allocation: optimism prevails

Vaccination programmes are gathering pace around the world and economic prospects are brightening too, bolstered by additional fiscal stimulus. We therefore continue to hold an overweight stance on equities, with a tilt towards countries and industries most exposed to the economic recovery. Our stance is also informed by what our technical readings tell us about the risk posed by the apparent surge in the influence of non-professional traders in parts of the equity market. 

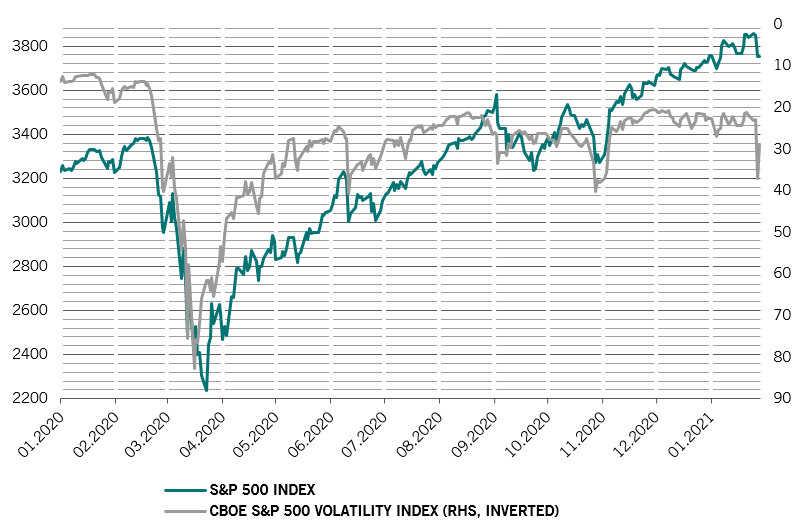
It is concerning to see that the tussle between day traders and hedge funds over shares in loss-making games retailer GameStop – which saw the stock jump 400 per cent in one week – has spread to other companies. The surge in trading activity and hedge funds reducing their positions in other more widely held equities has caused one of the sharpest daily spikes in market volatility ever recorded.

Fig. 1 - Monthly asset allocation grid
February
February asset allocation grid
Source: Pictet Asset Management

Even so, we do not believe markets have become inherently unstable. Investor positioning data offers some reassurance. Despite inflows of USD60 billion into equities and USD46 billion into fixed income since the start of the year, the “wall of money” that remains in money market funds has barely budged, which leaves room for further rallies.

Of course, the situation could worsen if hedge funds nursing losses from the rally in stocks such as GameStop are forced into a sustained fire-sale of other assets. But that looks unlikely. And what is more, none of this alters what is an otherwise improving fundamental picture.

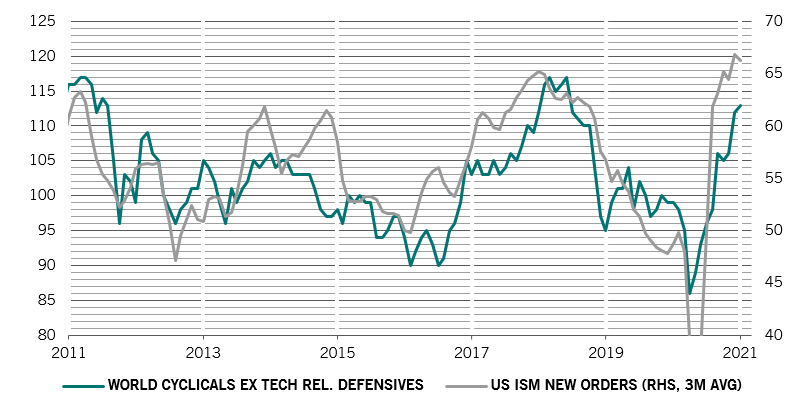
Our business cycle indicators support our positive stance on equities. Although the latest wave of lockdowns has prompted a dip in activity, the slowdown has been relatively mild and daily data is already bouncing back. Manufacturing has not been shut down this time round, and businesses in general are much better prepared. Governments, meanwhile, are ready to step in with additional stimulus. 

We expect the world economy to grow 6.1 per cent this year – slightly above consensus forecasts – as additional fiscal stimulus and the vaccine rollout support spending and consumer confidence. This reflects upgrades in our forecasts for the US, euro zone and emerging market economies. The latter will benefit from the rise in demand and prices for commodities. Emerging economies are also historically more than twice as sensitive than their developed peers to changes in global trade, which is recovering well. Asia ex Japan will see the highest growth (8.9 per cent), followed by EMEA (4.9 per cent), then Latin America (3.9 per cent). We are thus overweight on both EM equities and local currency EM debt. 

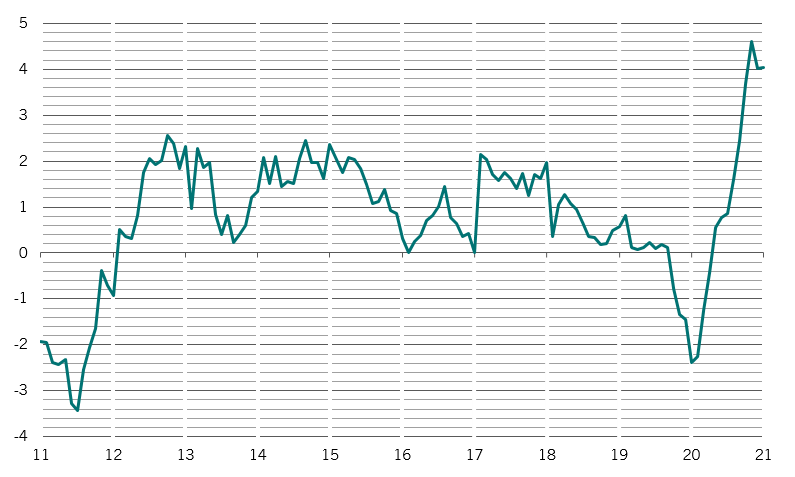
As long as inflation remains muted, and we expect it will for the rest of the year, central bank policy should remain supportive. However, liquidity conditions are gradually becoming tighter. Private liquidity is now back to its historical average; the credit boom sparked by government loan guarantee schemes has faded from view. The total liquidity pool  in the US, China, euro zone, UK and Japan has shrunk to 16 per cent of GDP – down from a peak of 28 per cent in August, but still one standard deviation above its long-term average.  

Exceptionally loose monetary policy has pushed up valuations  for all major asset classes. Currencies aside, no asset in our model is a “buy” based on valuation alone. 

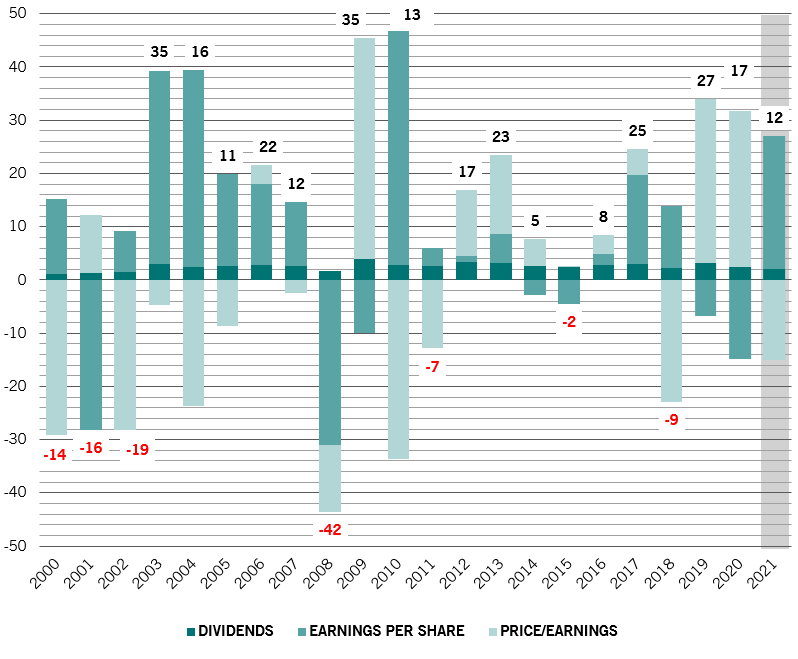
That said, the steady decline in long-term interest rates is likely to have a lasting impact on price-to-earnings ratios. What was expensive 20 years ago may not be so in the future. Bond yields are some 100 basis points lower today due to financial repression. While a price-earnings ratio of 23 times for the S&P 500 looks very expensive on all fronts it may no longer be reasonable to expect it to revert to its previous cycle average of 15 times.

Fig. 2 - Earnings power
Total returns for MSCI All Country World Index, %
Global equities returns
Bars indicate contribution to total returns from each factor: earnings growth, dividends and changes in the p/e multiple. Source: Refinitiv, MSCI, Pictet Asset Management. Data covering period 01.01.2000-31.12.2020; forecasts for 2021.

We see more upside on corporate earnings than we did three months ago, particularly among companies operating in cyclical sectors. This should report total return from equities (see Fig. 2). 

Overall, while valuations are expensive for riskier assets, they are nowhere close to bubble levels of 2007, which suggests that there is still a long cycle in front of us as long as the macro backdrop is supportive.

02

Equity regions and sectors: a tilt to cyclicals

Our positive view on equities is reinforced by our economists’ upwardly revised forecast for the global economy. And though it’s true that economic momentum could stutter over the near-term amid a fresh wave of lockdowns, hefty flows of fiscal stimulus and continued support from central banks should continue to underpin stocks, particularly in the US and the euro zone. Emerging markets, meanwhile, are being lifted by a strong rebound in exports – for instance, Chinese exports are up 18 per cent from where they were in December 2019. 

As a result, we are reducing our weighting in defensive equity sectors by downgrading the healthcare sector to neutral. Such stocks are expensive and particularly vulnerable to policy activism in the US. President Biden’s administration is casting an eye over the regulatory landscape and big pharma is an easy target. 

Our largest overweight positions are now in more cyclical sectors such as materials, industrials and consumer discretionary. Although cyclical stocks price to earnings ratios relative to those of defensives has been climbing, strength in leading economic indicators suggests there remains room for cyclicals to see further upward rerating (see Fig. 3).

Fig. 3 - Favouring cyclicals
Relative return of MSCI World cyclicals (ex tech) to defensives (cyclically adjusted price to earnings ratios) vs US ISM leading indicators
Cyclicals vs defensives
Cyclical sectors include consumer discretionary, materials and industrials.  Defensives include utilities, healthcare, consumer staples and telecommunications. Source: Refinitiv. Data covering period 01.01.2006-01.01.2021.

We also hold higher-than-index positions in emerging market and Japanese equities.

Within emerging markets, China is a particularly positive story – the manufacturing and export-driven rebound that started last year is being supplemented with domestically-generated demand, which has pushed the country’s main activity indicators to well above where they were pre-pandemic.

Corporate profitability is expected to rebound strongly across all the markets we look at. Our forecasts are for earnings to jump 26 per cent, 29 per cent, 32 per cent and 33 per cent on the year in emerging markets, the US, Japan and the euro zone respectively, for a 29 per cent gain globally. These are underpinned by robust expectations for overall economic growth.

The longer-term outlook for equities markets more generally, however, is less clear. Investors are pricing a full return to normal growth but in an environment of permanently lower rates. At some point, central banks will have to start withdrawing stimulus in response to rising inflationary pressures. That will potentially be a significant problem for the market, given that, based on our models, global equity valuations are now at their most expensive since 2008.

Rising rates tend to force down equity price to earnings ratios – especially given that relative to bonds, equities don’t look particularly cheap, with the ratio of returns between the two now 36 per cent above trend. Our models suggest the market is due for a 20 per cent decline in stocks' earnings multiples during 2021, with US equities particularly richly priced. The question then is whether earnings will rise enough to compensate. While we anticipate an above-consensus rise in global earnings this year, any disappointment on this front would mean that the market could end up treading water during the back half of the year.

03

Fixed income and currencies: a mini tantrum

The climate for fixed income investors remains challenging.

Not only are a record USD17 trillion of global bonds yielding less than zero, but inflationary pressures are also building.

In the US, where the economy is recovering strongly, the five-year breakeven inflation rate – a gauge of market expectations for inflation – doubled in the past six months to reach 2.1 per cent for the first time since mid-2019.

That has raised concerns the Fed might soon scale back its bond buying programme. In an event reminiscent of the “taper tantrum” bond market sell-off in May 2013, longer-term Treasury yields shot higher in the first few weeks of January, steepening the yield curve – or the slope of US Treasury yields from two to 10-year maturities – to levels not seen since mid-2017.

Although yields have since fallen back a little, this episode serves as a reminder that risks of a shift in monetary policy will persist throughout the year.

That said, we don’t believe a near-term jump in inflation would force the Fed into scaling back stimulus. Core inflation in the US will not reach 2 per cent before 2022; yields should rise only gradually in the coming years. We therefore remain overweight US Treasuries.

Fig. 4 - China's yield appeal
China 10-year real yield minus US 10-year TIPS
China's bond yield vs US TIPS chart
Source: Refinitiv, Pictet Asset Management.  Data covering period 01.01.2011 – 01.01.2021. China 10Y real yield = 10Y government bond yield adjusted by CPI YoY.

As a source of yield, Chinese bonds continue to be an attractive investment.

The USD7 trillion market is going from strength to strength. The economy is staging a V-shaped recovery from a Covid slowdown, boosting the bond market’s real yield differential with the US to a record 400 basis points.1

At the same time, China’s core inflation stands at a 10-year low of 0.4 per cent, which should prevent a tightening of the country’s monetary policy. Indeed, Chinese monetary authorities have pledged to maintain the support needed for continued recovery and not to make “sharp turns” in policy.

What is more, investors can look to the prospect of additional return from an appreciating renminbi (RMB) currency, which has risen 10 per cent since May to trade beyond 6.5 per dollar for the first time since June 2018.

Given our strong preference for China, we upgrade our exposure to emerging market local currency bonds.

Separately, we maintain our cautious stance on developed market corporate bonds, where investors are not sufficiently compensated for the risks of default.

We cut our exposure to US investment grade bonds to neutral as yields have fallen below zero in real terms for the first time. We also remain neutral on corporate bonds in the euro zone, where the economy is in a double-dip recession and valuations for fixed income are unattractive.

In currency markets, we downgrade our exposure to sterling as the lift it enjoyed from the Brexit deal secured in December begins to fade and the outlook for the UK economy deteriorates.

We also think the dollar could bounce back in the near term after it has fallen more than 10 per cent from its March peak on a trade-weighted basis.

What is more, pressure on the dollar from the Fed’s “debt monetisation”– or a practice of printing money to finance government deficit – appears to be receding. Our analysis shows the Fed “monetised” 70 per cent of fiscal deficit last year, debasing the currency as a result. We expect this to fall to 30-35 per cent later this year.

Elsewhere, we remain overweight the Swiss franc.

04

Global markets overview: populism upends Wall Street

January 2021 will be remembered as the month when populism shook the foundations of Wall Street.

Amateur traders, whose ranks and investment resources have swollen with the emergence of commission-free trading platforms and as governments have enforced lockdowns and boosted welfare payments, launched a co-ordinated assault on hedge funds with short positions in struggling firms.

By driving up the shares of heavily-shorted companies such as video games retailer GameStop - which rallied by much as 1600 per cent on the month - day traders succeeded in inflicting heavy losses on some of the most revered money managers.

According to Barclays, hedge funds could be nursing potential losses of up to USD40 billion on short positions in firms targeted by the ’short squeeze', which also included media group AMC Entertainment and wireless tech firm Blackberry.

The buying spree saw daily trading volumes hit their highest levels since the depths of the 2008 credit crisis on Wednesday 27 January, when 24 billion of shares and a record 48 billion of stock option contracts changed hands, according to clearing house Options Trading Corp.

Fig. 5 - Unsettling volatility
S&P 500 index and volatility, as measured by CBOE Volatility Index (VIX)
S&P 500 index and volatility, as measured by CBOE
Source: Refinitiv, CBOE, Pictet Asset Management. Data covering period 01.01.2020-28.01.2021.

The volatility of share prices also spiked, with the VIX index surging (see Fig. 5) by much more than could be expected given the relatively modest decline in equity prices.

The disruption caused by day traders unsettled a market already concerned by high valuations, the persistently high Covid-19 infection rates and delays in the rollout of vaccinations.The fourth quarter earnings season has so far been positive but companies' lack of clarity on 2021 prospects also weigh on stocks. The MSCI World Index of global stocks ended marginally down on the month in US dollar terms while US stocks fell by almost 1 per cent. Bonds also ended lower in both local  currency and US dollar terms while oil gained more than 6 per cent, helping energy stocks deliver returns of some 2 per cent. 

05

In brief

barometer february 2021

Asset allocation

As the global economy recovers, we favour equities, with a neutral stance in bonds and an underweight in cash.

Equity regions and sectors

We downgrade the healthcare sector to neutral, tilting our balance towards cyclical stocks and amid concerns the Biden administration will more aggressively regulate big pharma.

Fixed income and currencies

We upgrade EM local currency bonds, reflecting our preference for Chinese bonds. We downgrade US investment grade bonds to neutral.