Emerging market assets' premium yields and growth prospects can over the long run outweigh their short-run volatility.
Written by
John Moorhead, Head of Emerging Equities
Share this article
Investors buy EM assets for a number of reasons, not least diversification benefits, whether geographic, economic or in terms of risk-reward profiles. What’s more, those who catch EM cycles right can generate super-charged beta. Unfortunately, variance on those returns is also high. Get the timing wrong and the car spins off the road. In downturns, EM markets’ relative illiquidity can exacerbate already substantial moves. This riskiness is a deterrent to many investors.
But for pension funds and other investors with long time horizons, EM’s short-term risks can largely be negated by the power of compounded risk premia. Over rolling 10 or 15 year periods, EM assets – both equities and bonds – have historically generated exceptional returns.
We argue here that emerging market assets can help pension funds earn the relatively secure premium income they need to match their multi-decade liabilities but still have the benefit of moderate liquidity as long as they’re willing to brave bouts of mark-to-market volatility.
The growth case for EM
There’s no doubt that emerging market assets have struggled in the past few years.
premium growth
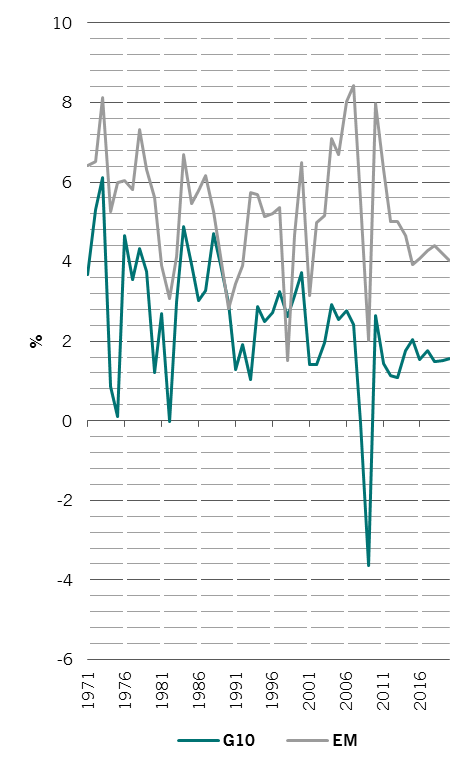
Annual GDP growth rates for emerging and developed countries
Source: Pictet Asset Management, CEIC, Datastream. Forecast from 2016
A number of factors have been to blame: an appreciating dollar, amid US economic strength; weak commodity prices; and, more recently, expectations that the US Federal Reserve would tighten monetary policy amid an ever tighter domestic labour market.
But over longer time horizons, EM assets should benefit from stronger economic growth. And, on this measure, emerging economies have clearly outpaced developed markets over recent decades. Since 1990, the top 10 developed economies grew by an average of just under 2 per cent per year in inflation-adjusted terms. By contrast, emerging economies grew by more than 5 per cent a year.
Emerging market economies also appear to be growing more stable. Even when commodity prices slumped, commodity exporting countries like Mexico, Peru, Chile and Colombia sustained the shock reasonably comfortably. In part, that’s because EM countries have been making significant strides in diversifying their sources of growth, while fiscal restructuring and strengthening of domestic institutions, such as granting independence to their central banks, has further boosted these economies’ resilience.
Bond spreads add up
EM fixed income benefits from economic growth, which is a key determinant of a country’s development and ultimately its political stability. Both, in turn, make it more likely that a sovereign borrower is willing and able to honour its obligations. And evidence suggests emerging market governance has broadly trended higher in recent decades, albeit with some erosion from their peak years around 2010, according to the World Bank’s indicators.
EM countries, however, have historically had a poor inflation record. That’s a particular danger for fixed income investors.
It helps that over the past couple of decades, inflation has trended down across EM economies, in part with general global deflationary pressures, but also as EM governments have learned painful economic lessons from episodes of overly lax monetary and fiscal policy. Another solution to this inflation risk has been for EM countries to issue debt denominated in hard currencies. Investors in such securities are rewarded with a substantial premium over US Treasury bonds, the benchmark risk-free asset, for the EM bonds’ relative lack of liquidity and repayment risk. For instance, the current yield on EM hard currency debt is 6.0 per cent, some 360 basis points more than what US Treasury bonds are offering.
Over time that yield premium adds up. For instance, since the start of 1998, the cumulative total return of the EM hard currency bond index (EMBI) is 393 per cent. Of that, 12 percentage points have been generated by a narrowing of spreads between the EM bonds and US Treasuries, with a further 14 percentage points coming from gains in US Treasury bonds. However, a whopping 367 percentage points of the total returns have been down to the compounding effect of the EM bonds’ coupons.1
accumulating returns
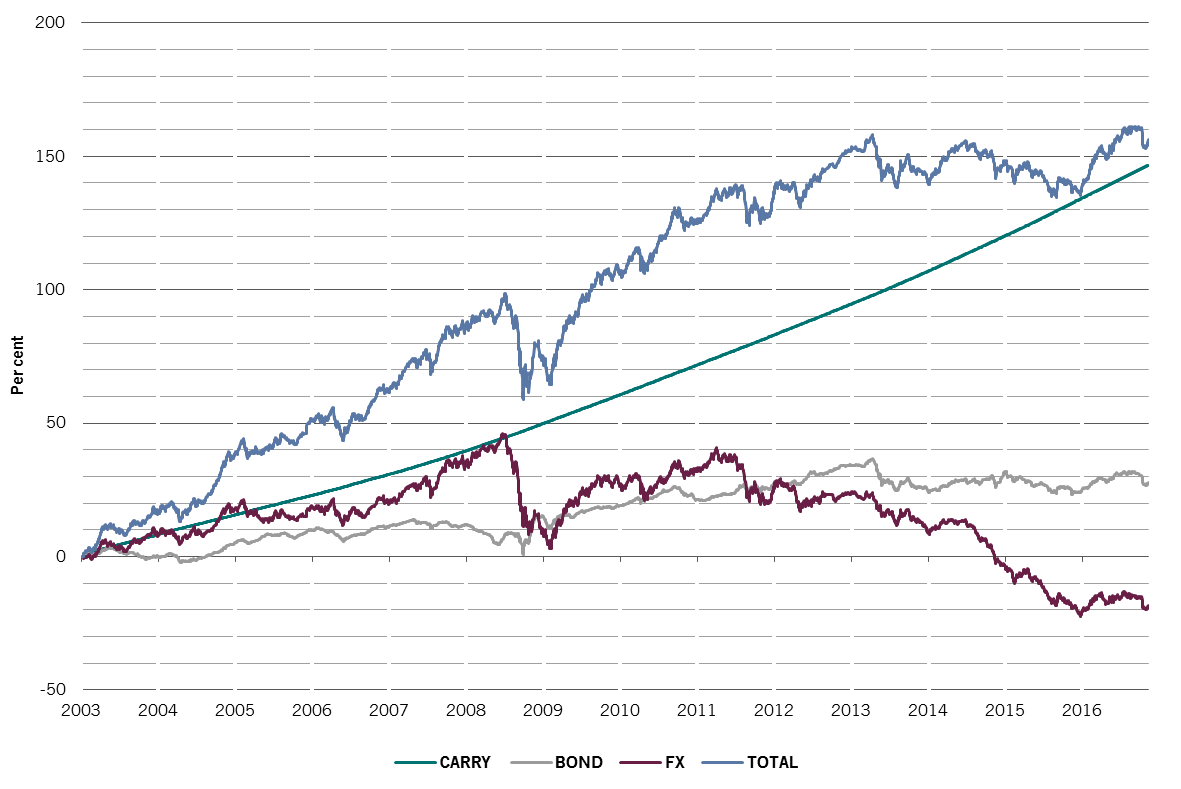
Components of cumulative return for EM local debt
Source: Pictet Asset Management, JP Morgan GBI-EM Global Diversified, 06.12.2016
What’s more, EM hard currency bonds have a shorter duration of 7 years against 10 years for the US government paper. Shorter duration means that the capital value of the bonds is less sensitive to changes in interest rates, i.e. when rates rise the bond prices fall less.
Foreign exchange factors clearly affect EM debt priced in local currencies. But in exchange for devaluation risk, investors gain even more premium than on dollar-denominated EM debt. For instance, EM local debt currently offers a yield of 6.9 per cent, 450 basis points more than US Treasury bonds, and with the additional advantage of a relatively short 5 years’ duration.
Eventually, this premium swamps currency effects. For example, investors buying an EM local currency bond index at the start of 2003 would have suffered an 18 percentage point hit from currency effects by the fourth quarter of 2016, but would have earned 146 percentage points from the coupons. Once gains from the rise in the bond index’s capital value are factored in, an investor would have earned a 156 per cent return on these bonds.2
The case for EM equities
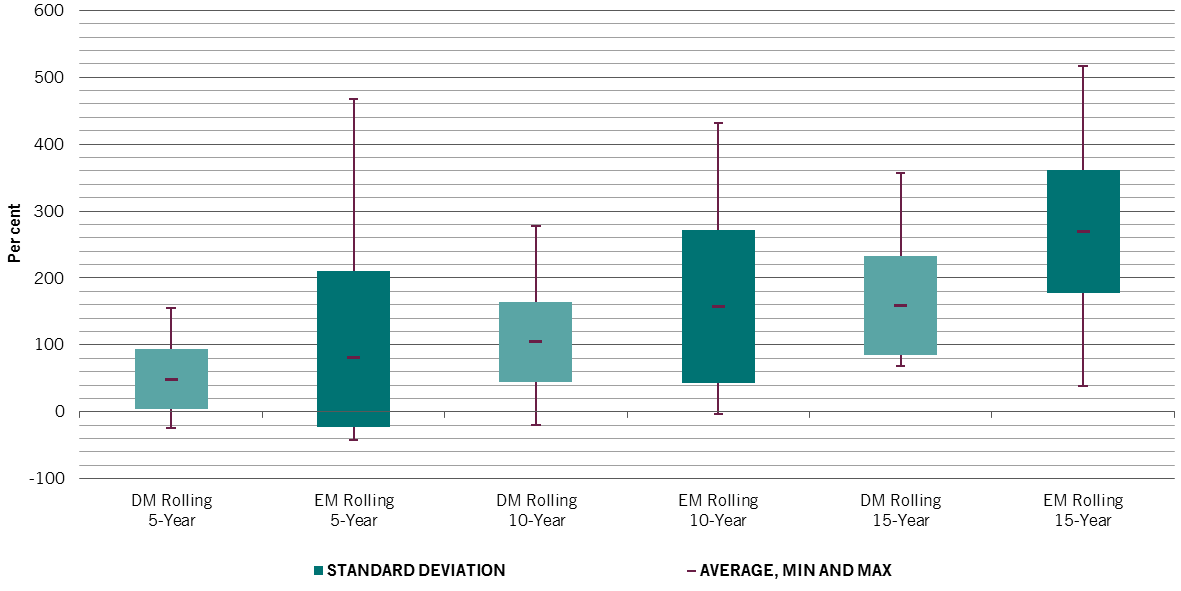
If holding EM debt over the long run is a good source of returns, that’s also true for income-generating equities. On a 5-year rolling basis, the total return from MSCI’s Emerging Markets Index has beaten that of the MSCI World Index of developed market equities by more than 30 percentage points (based on data beginning with the MSCI EM Index launch in 1988) in dollar terms. However, this outperformance comes with a caveat: the dispersion of performance in EM equities over 5 years is considerable. In other words, over short- to medium-time horizons the emerging market equities index is substantially riskier than the developed market index.3
keeping it rolling
Rolling 5-year, 10-year and 15-year total US dollar returns for MSCI World and Emerging Markets indices
Source: Pictet Asset Management, MSCI, Bloomberg, Datastream, 30.11.2016. Data series begins end-1987
But over longer periods, this disadvantage fades. For instance, on a 10-year rolling basis, EM equities have a significantly higher average return than DM equities, with similar downside risks as in DM equities and with considerably better upside. This trend becomes even more evident on a 15-year rolling basis. In other words, the longer the investors’ time horizons, the better the performance they can expect to generate from EM equities relative to DM peers on both an absolute and risk-adjusted basis.
Dividends matter
Dividends are a major component of EM total return. Reinvested dividends represent nearly half of total EM equity returns in dollar terms between December 2000 and February 2016, some 140 percentage points of gains. Indeed, that dividend component alone is double the total return of developed market equities over the same period.4
Dividend payments are supported by stronger balance sheets. EM corporates’ net debt to equity has dropped from over 55 per cent in 2000 to under 30 per cent in 2015. As a result EM companies have been increasing their dividends over recent years – 60 per cent increased dividends in 2015 – or starting pay-outs.5 Indeed, a bigger percentage of firms in the MSCI EM universe pay dividends than in the equivalent developed market index – some 94 per cent against just under 90 per cent by mid-2016. By comparison, less than 50 per cent of EM companies paid dividends in 1998.6
What's good for dividends is good for credit
These same strong fundamentals help to underpin EM corporate bonds. A burgeoning asset class, EM corporate credit is another attractive source of income. Relative to comparably-rated developed market corporate debt, EM firms are typically less leveraged and thus carry less financial risk. For instance, in 2015 net leverage among EM high yield credits was under 2.3 times against 3.1 times for their US equivalents.7
At the same time, default and recovery rates are similar to those for US companies. Since 2000, US high yield default rates have averaged around 3.6 per cent, while those for EM high yield have been around 3.1 per cent.8 And average recovery rates for senior unsecured debt in EM regions have ranged from 31 per cent to 44 per cent, against 38 per cent for the US.9 And yet these bonds offer substantial premium income – by mid-December, the yield on EM investment grade corporate credit was around 50 basis points more than equivalent US corporates. And not only do EM corporate bonds have better yields than their US equivalents, but they have shorter duration.
EM's immediate attractions
EM bonds and dividend-paying equities clearly have much to recommend them over the long run. But there are also reasons to believe that investors should begin raising their exposure over the next several months.
Inflation concerns are mounting in developed economies, not least in the US, where unemployment has dropped to levels at which wage pressures start to appear, while US President-elect Donald Trump threatens to overheat the economy with a massive promised fiscal spending programme. But at the same time, inflation in emerging markets continues to trend down, even though we forecast real GDP to grow at more than double the pace of the developed world through to the end of the decade.
Meanwhile, political risks seem to be rising across the developed world. Brexit has cast a cloud over the UK while continental Europe is also facing potential ructions, not least from this year's French presidential election. That's not to mention the trade turmoil Trump's policies could yet ignite. Credit rating agency Standard and Poor's went so far as to argue that populist policies across advanced economies have eroded their differences with emerging markets.10
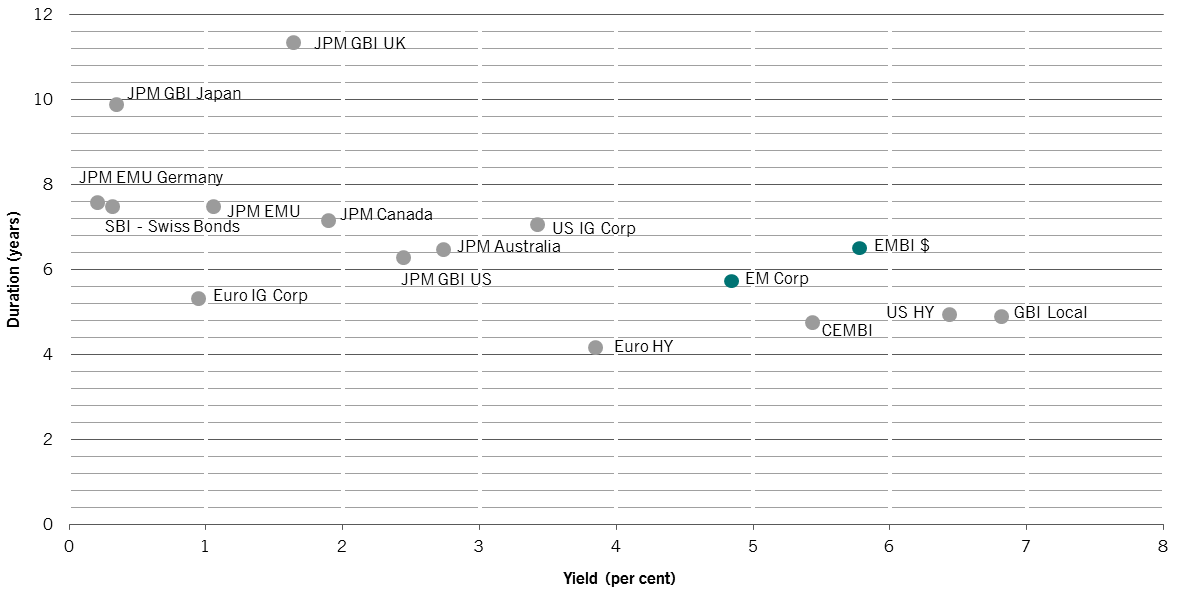
EM bonds also have a much more attractive balance between yield and duration than most developed market counterparts. Add in their substantially higher yields and investors are more protected from the vagaries of central bank policy.
At the same time, recently stronger commodity markets should benefit EM currencies and EM economies more generally – although over the medium term an increasing shift towards domestically-focused companies should help buffer EM equity indices from the volatility of resource-dependent stocks.
What’s more, EM currencies are cheap relative to the US dollar. Indeed, the dollar is the most expensive it has been since the mid-1980s, making this an attractive entry point for EM assets, according to our economists’ analysis.
In other words, macro and market trends suggest that EM equities should gain from here while EM bonds should fare less badly than their developed market counterparts – which is to say, spreads should narrow.
EM for all seasons
Investors tend to overlook emerging markets assets’ long term attractions in the face of short term volatility. Fear of substantial mark-to-market losses amid foreign exchange swings are a particular deterrent. But we have shown that the benefits of compounding emerging market assets’ significant premia – in terms of yield for bonds and growth prospects for equities – far outweigh the risks over a significantly long time horizon. Even currency devaluations fade in significance against the power of compound interest.
Investors with long-run time horizons should treat EM assets in much the same way that they do alternatives, as long-term buy and holds, rather than merely adding a sliver to their bond or equity allocations as short-term bets.
Share this article
Important legal information
This marketing document is issued by Pictet Asset Management. It is neither directed to, nor intended for distribution or use by any person or entity who is a citizen or resident of, or domiciled or located in, any locality, state, country or jurisdiction where such distribution, publication, availability or use would be contrary to law or regulation. Only the latest version of the fund’s prospectus, the KIID (Key Investor Information Document), regulations, annual and semi-annual reports may be relied upon as the basis for investment decisions. These documents are available on assetmanagement.pictet.
This document is used for informational purposes only and does not constitute, on Pictet Asset Management part, an offer to buy or sell solicitation or investment advice. It has been established on the basis of data, projections, forecasts, anticipations and hypothesis which are subjective. Its analysis and conclusions are the expression of an opinion, based on available data at a specific date. The effective evolution of the economic variables and values of the financial markets could be significantly different from the indications communicated in this document.
Information, opinions and estimates contained in this document reflect a judgment at the original date of publication and are subject to change without notice. Pictet Asset Management has not taken any steps to ensure that the securities referred to in this document are suitable for any particular investor and this document is not to be relied upon in substitution for the exercise of independent judgment. Tax treatment depends on the individual circumstances of each investor and may be subject to change in the future. Before making any investment decision, investors are recommended to ascertain if this investment is suitable for them in light of their financial knowledge and experience, investment goals and financial situation, or to obtain specific advice from an industry professional.
The value and income of any of the securities or financial instruments mentioned in this document may fall as well as rise and, as a consequence, investors may receive back less than originally invested. Risk factors are listed in the fund’s prospectus and are not intended to be reproduced in full in this document.
Past performance is not a guarantee or a reliable indicator of future performance. Performance data does not include the commissions and fees charged at the time of subscribing for or redeeming shares. This marketing material is not intended to be a substitute for the fund’s full documentation or for any information which investors should obtain from their financial intermediaries acting in relation to their investment in the fund or funds mentioned in this document.
EU countries: the relevant entity is Pictet Asset Management (Europe) S.A., 15, avenue J. F. Kennedy, L-1855 Luxembourg
Switzerland: the relevant entity is Pictet Asset Management SA , 60 Route des Acacias – 1211 Geneva 73
Hong Kong: this material has not been reviewed by the Securities and Futures Commission or any other regulatory authority. The issuer of this material is Pictet Asset Management (Hong Kong) Limited.
Singapore: this material is issued by Pictet Asset Management (Singapore) Pte Ltd. This material is intended only for institutional and accredited investors and it has not been reviewed by the Monetary Authority of Singapore.
For Australian investors, Pictet Asset Management Limited (ARBN 121 228 957) is exempt from the requirement to hold an Australian financial services license, under the Corporations Act 2001.
For US investors, Shares sold in the United States or to US Persons will only be sold in private placements to accredited investors pursuant to exemptions from SEC registration under the Section 4(2) and Regulation D private placement exemptions under the 1933 Act and qualified clients as defined under the 1940 Act. The Shares of the Pictet funds have not been registered under the 1933 Act and may not, except in transactions which do not violate United States securities laws, be directly or indirectly offered or sold in the United States or to any US Person. The Management Fund Companies of the Pictet Group will not be registered under the 1940 Act.
Pictet Asset Management Inc. (Pictet AM Inc) is responsible for effecting solicitation in North America to promote the portfolio management services of Pictet Asset Management Limited (Pictet AM Ltd) and Pictet Asset Management SA (Pictet AM SA).
In Canada Pictet AM Inc. is registered as Portfolio Manager authorised to conduct marketing activities on behalf of Pictet AM Ltd and Pictet AM SA. In the USA, Pictet AM Inc. is registered as an SEC Investment Adviser and its activities are conducted in full compliance with the SEC rules applicable to the marketing of affiliate entities as prescribed in the Adviser Act of 1940 ref. 17CFR275.206(4)-3.
This website uses cookies to enhance user experience and to collect statistical data. You may refuse to accept cookies or change your settings by clicking the following link: Cookies policy. By continuing to browse this website, you accept the use of cookies for the above purposes.