Global market overview - Return of the bond vigilantes?
A sharp rise in bond yields dominated investors’ attention in October. The magnitude of the move will no doubt leave many wondering whether fixed income’s long bull run might be reversing, a concern that has started to cloud the prospects for financial markets more generally.
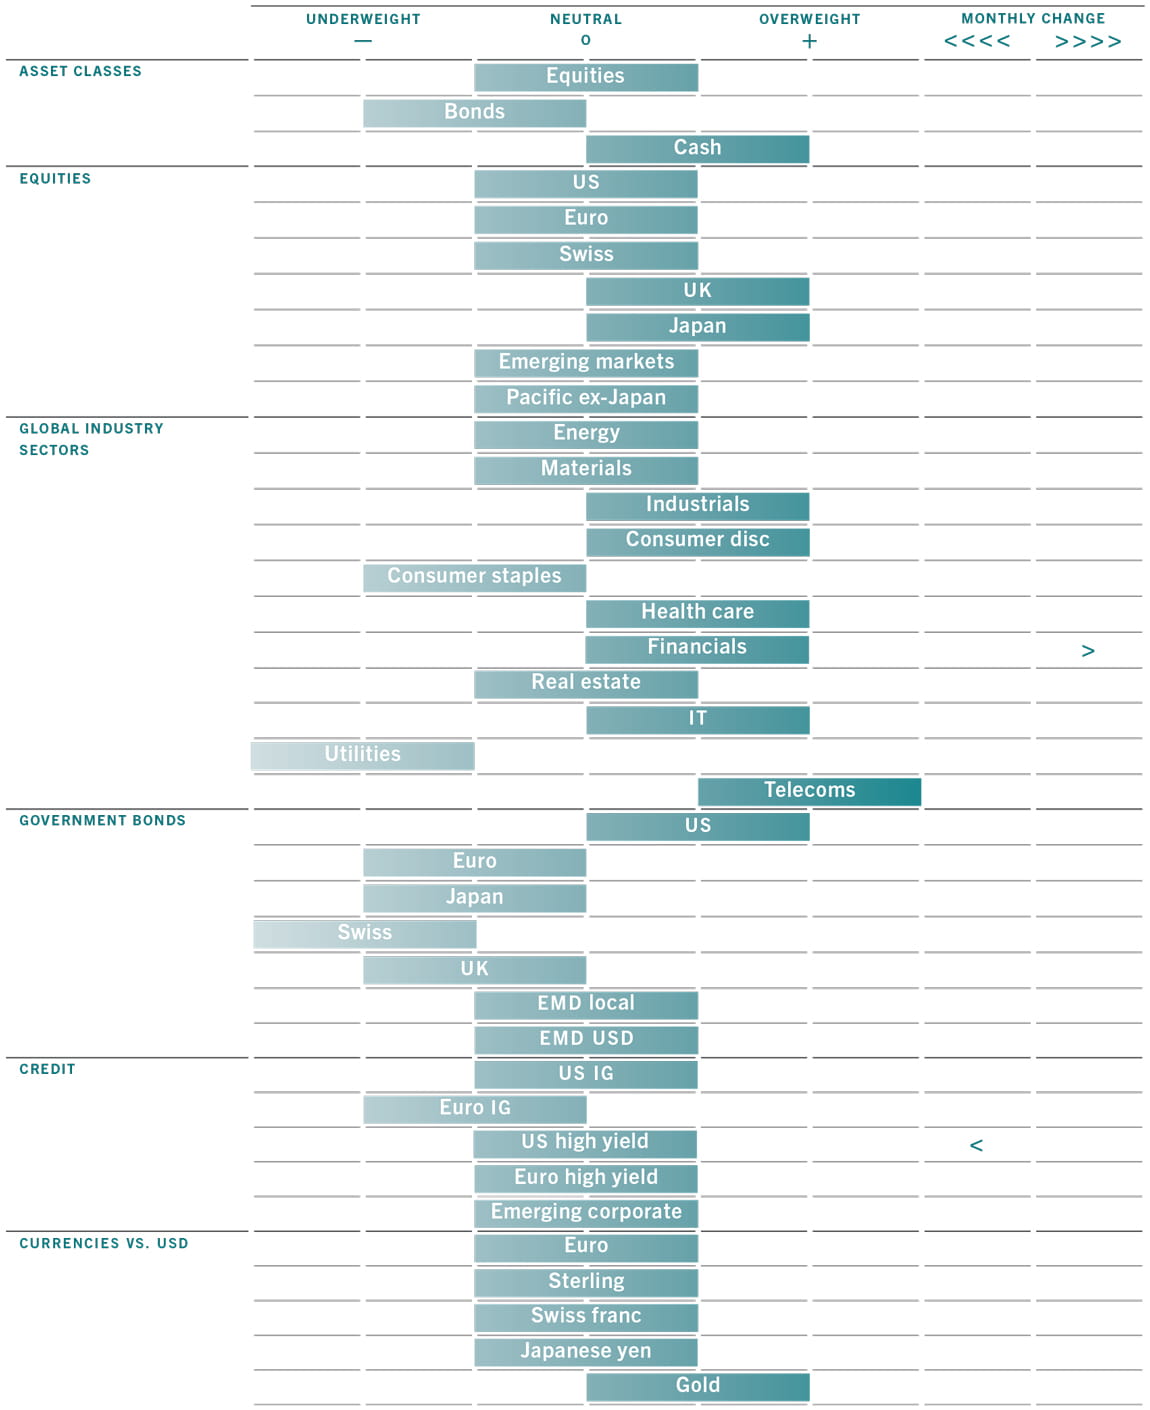
Monthly asset allocation grid
Source: Pictet Asset Management, 31/10/2016
Global bonds – as measured by the Barclays Global Aggregate Index – posted a loss of more than 3 per cent on the month in US dollar terms, with UK sovereign debt dropping 10 per cent – though this was in part down to dollar strength. In local currency terms, global bonds overall lost around 1.5 per cent, while UK gilts were down about 4 per cent. Driving the bond market shakeout is the worry that central banks will start turning off the liquidity taps in the face of steady economic growth and rising inflation. Indeed, the US 5y5y breakeven yield – a gauge of investors' long-term inflation projections – moved up to 1.9 per cent, its highest level since the end of 2015. A variety of factors are behind building price pressures from purely technical base effects – favourable year-on-year comparatives are dropping out of the data – to more fundamental forces.
To begin with, a pick-up in commodity prices following their slump at the start of the year has started to filter through to consumers. Oil prices climbed back above USD50 a barrel from lows below USD30 earlier in the year. In all, they have risen more than a fifth since the start of the year, while commodities overall are up more than 7 per cent.
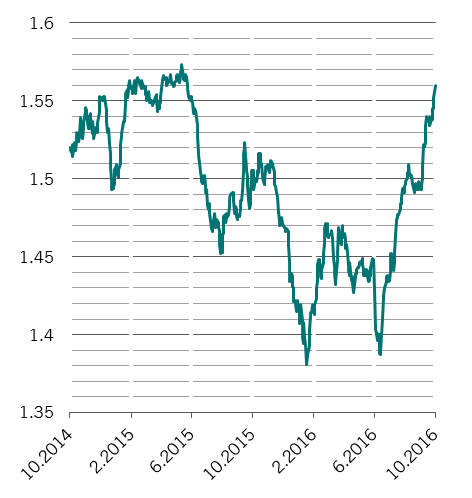
In the UK’s case, inflationary concerns were amplified by a sharp drop in sterling fuelled by fresh uncertainty about what sort of post-Brexit deal the government will be able to strike with the European Union. Sterling dropped more than 5 per cent on the month against the dollar, for a total loss of some 17 per cent on the year.
Cyclical stocks outpace defensive sectors in recent months
Relative return: cylical/defensive stock sectors
Source: Thomson Reuters Datastream. Cyclicals include materials, industrials, consumer discretionary and information technology; exclude financials and energy
But the primary force driving inflation expectations appears to be the likely elimination of the US’s output gap. With weekly jobless claims falling to lows not seen since the early 1970s, the signs are that wage pressures could intensify. The probability of a US Federal Reserve rate rise in December has risen above 70 per cent and there are expectations for two further hikes in 2017.
Stocks have, so far, taken the bond market moves with surprising equanimity. Global equities were largely flat in local currency terms on the month, though there was increasing dispersion between sectors. Cyclical stocks fared the best, with energy, materials and financials managing gains in local currency terms and consumer discretionary edging back only slightly. Meanwhile, some of the biggest losers were defensive sectors, which tend to be closely correlated with bonds, including staples and health care.
02
Asset allocation - Neutral equity as liquidity conditions deteriorate
Over the past month, macro-economic conditions have improved across most developed countries. One support for equities has been a pick-up in inflation in the US and other advanced economies. This is boosting nominal GDP growth, which, in turn, is helping put an end to the corporate profits recession of the past year.
But as policymakers respond to rising prices by slowing or even reversing some of the aggressive monetary stimulus that has inflated bond and equity valuations over recent years, financial markets might soon have to contend with a slow but steady draining of central bank liquidity.
It is with this prospect in mind that we have retained our somewhat guarded asset allocation stance, remaining overweight cash, neutral on equities and negative on bonds.
Our business cycle gauges point to strengthening global growth, particularly across developed economies, with our proprietary leading indicators and PMIs all showing improvement. Emerging markets lagged a little, held back by flat global trade, yet growth in the developing world remains much stronger than it was at the beginning of the year.
Although most economies’ manufacturing sectors continued to suffer from a prolonged lack of capital expenditure, we’ve observed some signs of improvement, particularly in Japan and the euro zone. More broadly, we continue to expect consumer spending and housing activity to strengthen in line with growth in employment and wages, at the expense of a very gradual rise in inflation.
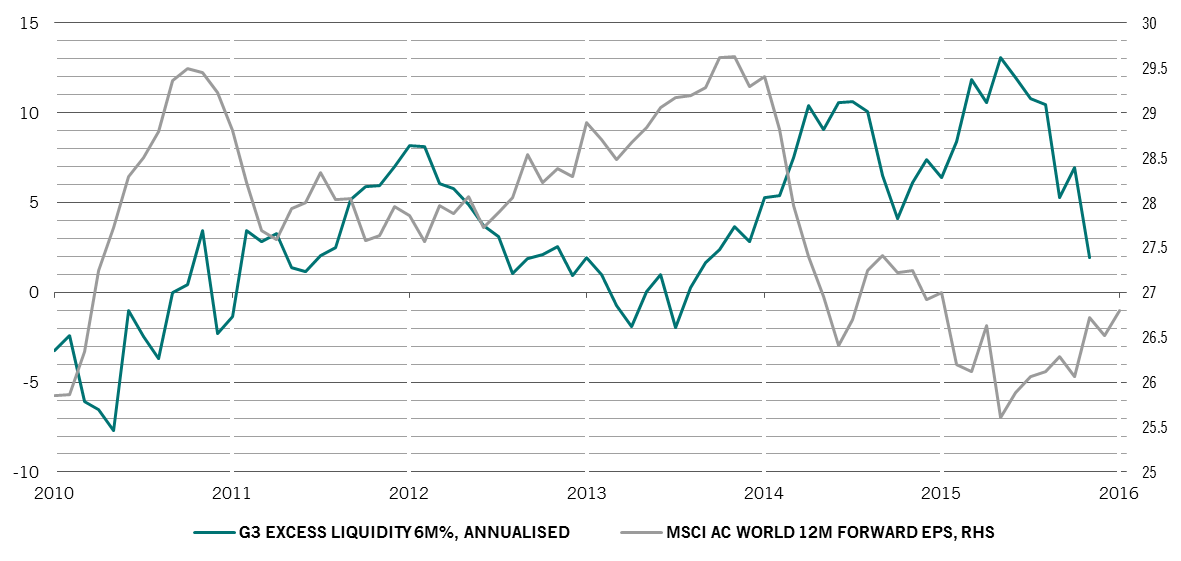
Central bank liquidity drain presents risk for global stocks
Source: Thomson Reuters Datastream, IBES. Excess liquidity is the 6 -month annualised growth rate of M2 money minus the GDP-weighted rate of expansion in industrial production
The Japanese economy is showing good momentum; its leading indicator is up as is industrial production, while consumption is also improving. But we await parliamentary approval of the latest fiscal stimulus programme, worth JPY28 trillion over five years and which could add 0.3 percentage points to annual GDP growth, before deciding whether we should be even more optimistic on Japan.
Given gradually improving macro-economic conditions in the US, characterised by a healthy 3.6 per cent yearly increase in nominal wages, we expect the US Federal Reserve to raise rates in December by 25 basis points, possibly followed by two further hikes during 2017.
In the euro zone, credit transmission is gradually improving albeit with significant divergences across the region. The provision of credit to non-bank corporations continues to be modest but a weaker euro and a recent rise in business confidence indicators – which are now at their highest levels since April 2014 – foreshadow a pick-up in growth in the coming quarters.
Chinese growth has accelerated since the start of the year. Fiscal spending and rising industrial profits are starting to encourage businesses to invest in fixed assets while strong growth in property prices could support construction activity.
The macro-economic backdrop may be positive, but declining liquidity represents a challenge for investors. We are already seeing evidence of an indirect monetary tightening in Japan, following the Bank of Japan’s decision to shift from targeting the quantity of asset purchases to targeting the yield curve. At the same time, money market reform in the US has caused a spike in Libor rates.
According to our indicators, the liquidity drain is going to continue in the US at the end of this year, affecting not only the US markets but other areas that rely on US dollar funding. In fact, our analysis shows that global US dollar liquidity – as measured by the US monetary base and foreign official assets denominated in US dollars held at the Fed – is falling at its fastest pace ever at 5 per cent year-on-year. Private liquidity is also decelerating in the US, Europe and Japan, putting some potential downward pressure on stocks’ price-earnings ratios.
Our technical indicators paint a mixed picture for equities, even though there are wide discrepancies between individual regions and industry sectors. Investor positioning appears unusually cautious, with portfolio manager surveys showing cash holdings as a share of total investments close to levels comparable to those seen after 9/11 and Brexit. While this suggests there is scope for an equity rally heading into year end, a host of other gauges indicate a market correction is in store.
Government bonds and corporate debt in particular are trading well above fair value despite the recent sell-off .
From a valuation viewpoint, equity markets are fairly-priced. Japanese and European equities look relatively cheap while the US and Swiss markets are expensive.
Looking ahead, we expect earnings growth to be in the region of 10 per cent over the next 12 months, a view that is reinforced by the macro-economic backdrop. There is scope for European earnings to improve even further given that the region’s economy is less advanced in the cycle than the US’s and continues to show a negative output gap. This means that companies in Europe benefit from lower wage bills and, consequently, face less pressure on profit margins than their US counterparts. Elsewhere, government bonds and European corporate debt in particular are trading well above fair value despite the recent sell-off.
03
Equity region and sector allocation - Japan remains our top pick, financials looking better
Global equity markets are caught between two opposing forces. On one side, they are supported by improving macroeconomic fundamentals. On the other, they face increasingly negative liquidity conditions, which have been a critical support for asset prices over recent years. Over the long run, it is unclear which factor will dominate. For now, however, there is enough variation in macro-economic and liquidity conditions – not to mention valuations – across regional equity markets and stock sectors to open up a number of tactical investment opportunities.
Our valuation and growth metrics show that the US and emerging Latin American stocks in particular are expensive and offer a less compelling investment case than, say, Japan and emerging Europe. Japanese equities in particular look cheap, especially considering the market is trading at a lower P/E ratio than Brazil for the first time ever. What is more, if global bond yields rise in line with our forecasts, Japanese stocks should be expected to rise too.
If bond yields ratchet higher because global economic conditions are improving then, our analysis suggests that Japanese companies, among the world’s top exporters, should benefit disproportionately from that acceleration in growth.
Elsewhere, the UK stock market’s growth prospects have been given a boost by sterling’s dramatic depreciation since the summer’s vote to leave the European Union. Although Brexit is still more theory than reality – the British government is still trying to decide on its negotiating stance – negative headlines have been met by sharp currency moves. Sterling’s dollar exchange rate is now about 30 per cent below fair value, boosting the fortunes of the numerous British companies who generate their revenues outside the UK. Around 70 per cent of the revenues generated by firms in the FTSE 100 index come from overseas.
So, overall, we remain overweight both the UK and Japanese equity markets and neutral on other regions.
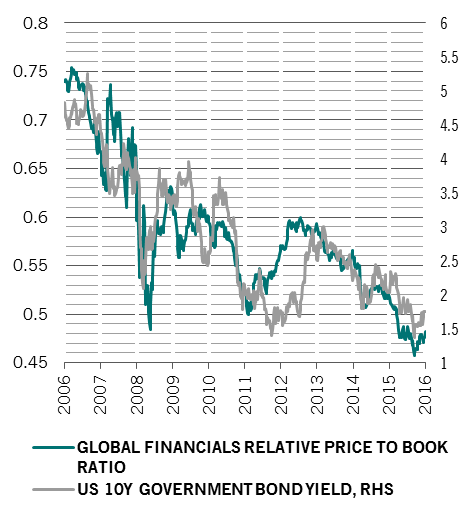
Financial stocks's appeal boosted by low valuations, rising yields
Source: Thomson Reuters Datastream
As long as markets remain relatively well behaved, the combination of moderate growth and rising bond yields could lead to further outperformance by cyclical sectors at the expense of defensive sectors trading at high valuation multiples such as staples. That’s surprising because both might be expected to suffer from the withdrawal of central bank support for the markets. But we think most of the pain will be felt by defensive stocks with bond-like characteristics, like utilities. Cyclical stocks should be further supported by their relatively low valuations – they normally trade at a 10 per cent premium to the rest of the market but currently they are at fair value, even after outperforming the market by 11 per cent since early July.
Under these circumstances, our current positions – overweight consumer discretionary, industrials and IT –should do well, with the latter two sectors benefiting from a rebalancing towards manufacturing investment.That’s not to say we see no value at all in defensive sectors: we like telecom and pharmaceutical stocks as both are attractively valued and under-represented in investment portfolios.
We have also decided to upgrade financials to overweight from neutral. This decision stems from a number of factors, including positive macroeconomic developments, which should support credit demand, bullish momentum indicators, a gradual steepening of yield curves, which can boost lending spreads, and cheap sector valuations. Global financials’ price-to-book ratios are trading at around a 50 per cent discount to fair value, similar to where they were at the depths of the financial crisis in March 2009. Meanwhile, European banks would particularly benefit from any decline in provisioning against bad loans.
04
Fixed income and currency allocation - Locking in gains on US high yield
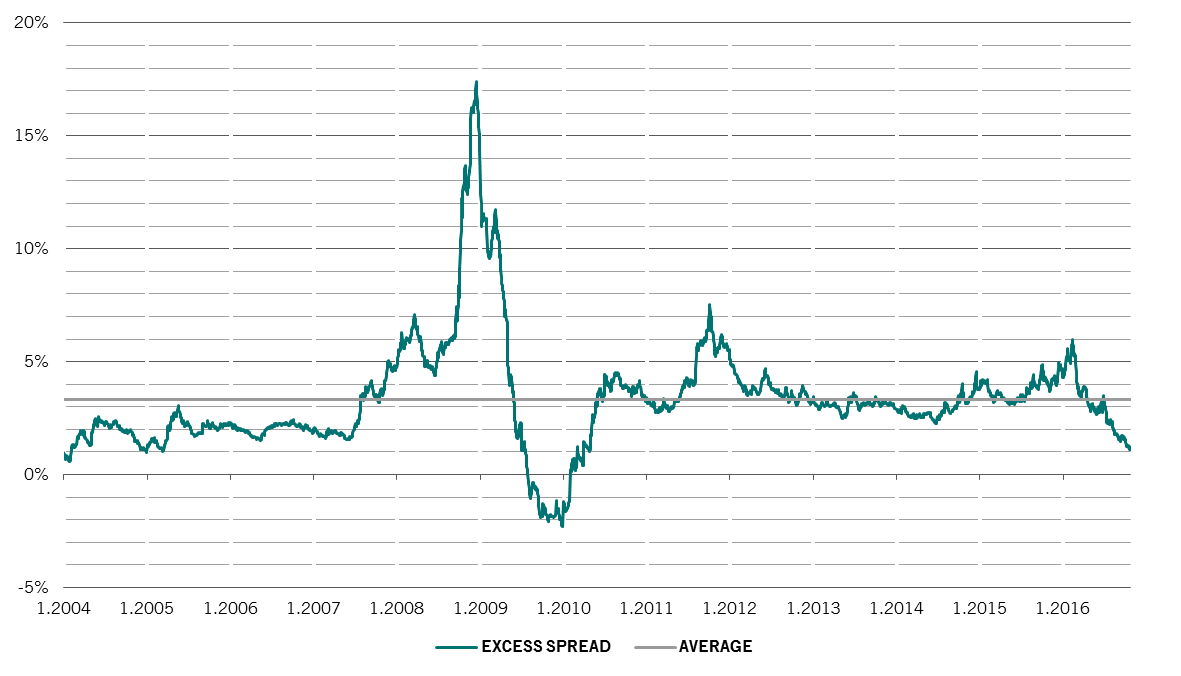
Investors who have piled into US high yield bonds over the past few months have been richly rewarded, with the asset class having delivered a return of some 15 per cent so far in 2016 in US dollar terms. Should that hold until the end of December, the annual performance will be the market’s third best in the past two decades. High-yield bonds’ spread over US Treasuries, meanwhile, has narrowed by more than 350 basis points since hitting a peak of close to 900 basis points in February.
Having held an overweight position in the asset class over most of 2016, we believe it is now time to scale back our exposure to neutral. There are a number of reasons for doing so.The main one is valuations. As the chart shows, the rally that has unfolded over the past several months has taken the option-adjusted yield spread on US non-investment grade debt to a level that is more than 200 basis points below the long-term average. As a result, the US market lost virtually all of its yield advantage over its euro zone counterpart.
Such a slim risk premium looks difficult to justify at a time when liquidity conditions are deteriorating in the US and bond default rates are slowly ticking higher: at 4.8 per cent, they are at a six-year high. What is more, our sentiment indicators suggest that investor positioning in US high-yield debt is excessively bullish, increasing the scope for a sell-off.
High yield bonds looking expensive
Source: Bank of America-Merrill Lynch, Pictet Asset Management. Spread is the option-adjusted spread as indicated by the Bank of America-Merrill Lynch US High Yield bond index after taking into account Moody's trailing 12-month default rate.
Yet another warning sign can be found in the primary bond market. Although the net volume of bond issuance is relatively modest, the coupons offered by new deals are ratcheting ever lower. This, in turn has taken the average coupon to about 6.5 per cent, 50 basis points down on the levels seen in 2014.
We however retain our preference for longer-dated US Treasuries. Although yields on such securities have risen considerably in recent weeks amid evidence pointing to a future rise in inflation, our view is that the structural decline in long-term economic growth and dovish Fed guidance should provide support for the longer end of the curve.
Elsewhere, we continue to hold a neutral position in emerging market debt. That goes for both US dollar and local currency bonds. The prospects for emerging market currencies look less compelling in wake of the strong run many of them have enjoyed since the beginning of the year. From the end of December 2015, the Brazilian real is up more than 25 per cent, the Russian ruble has gained some 15 per cent while the South African rand is up 11 per cent. These currencies could reverse course if, as our indicators suggest, demand for US dollars eclipses supply in the coming months and commodity price rally peters out.
05
Key takeaways
November 2016
Global asset classes
With monetary stimulus set to wane, we retain our neutral stance on equities and our overweight position in cash.
Equity
We retain our preference for Japanese stocks as economic conditions are improving; we upgrade financials to overweight.
Fixed income
We downgrade US high-yield bonds to neutral as the asset class now looks expensive.
This marketing material is issued by Pictet Asset Management (Europe) S.A.. It is neither directed to, nor intended for distribution or use by, any person or entity who is a citizen or resident of, or domiciled or located in, any locality, state, country or jurisdiction where such distribution, publication, availability or use would be contrary to law or regulation. The latest version of the fund‘s prospectus, Pre-Contractual Template (PCT) when applicable, Key Information Document (KID), annual and semi-annual reports must be read before investing. They are available free of charge in English on www.assetmanagement.pictet or in paper copy at Pictet Asset Management (Europe) S.A., 6B, rue du Fort Niedergruenewald, L-2226 Luxembourg, or at the office of the fund local agent, distributor or centralizing agent if any.
The KID is also available in the local language of each country where the compartment is registered. The prospectus, the PCT when applicable, and the annual and semi-annual reports may also be available in other languages, please refer to the website for other available languages. Only the latest version of these documents may be relied upon as the basis for investment decisions.
The summary of investor rights (in English and in the different languages of our website) is available here and at www.assetmanagement.pictet under the heading "Resources", at the bottom of the page.
The list of countries where the fund is registered can be obtained at all times from Pictet Asset Management (Europe) S.A., which may decide to terminate the arrangements made for the marketing of the fund or compartments of the fund in any given country.
The information and data presented in this document are not to be considered as an offer or solicitation to buy, sell or subscribe to any securities or financial instruments or services.
Information, opinions and estimates contained in this document reflect a judgment at the original date of publication and are subject to change without notice. The management company has not taken any steps to ensure that the securities referred to in this document are suitable for any particular investor and this document is not to be relied upon in substitution for the exercise of independent judgment. Tax treatment depends on the individual circumstances of each investor and may be subject to change in the future. Before making any investment decision, investors are recommended to ascertain if this investment is suitable for them in light of their financial knowledge and experience, investment goals and financial situation, or to obtain specific advice from an industry professional.
The value and income of any of the securities or financial instruments mentioned in this document may fall as well as rise and, as a consequence, investors may receive back less than originally invested.
The investment guidelines are internal guidelines which are subject to change at any time and without any notice within the limits of the fund's prospectus.
The mentioned financial instruments are provided for illustrative purposes only and shall not be considered as a direct offering, investment recommendation or investment advice. Reference to a specific security is not a recommendation to buy or sell that security. Effective allocations are subject to change and may have changed since the date of the marketing material.
Past performance is not a guarantee or a reliable indicator of future performance. Performance data does not include the commissions and fees charged at the time of subscribing for or redeeming shares.
Any index data referenced herein remains the property of the Data Vendor. Data Vendor Disclaimers are available on assetmanagement.pictet in the “Resources” section of the footer.
This document is a marketing communication issued by Pictet Asset Management and is not in scope for any MiFID II/MiFIR requirements specifically related to investment research. This material does not contain sufficient information to support an investment decision and it should not be relied upon by you in evaluating the merits of investing in any products or services offered or distributed by Pictet Asset Management.
Pictet AM has not acquired any rights or license to reproduce the trademarks, logos or images set out in this document except that it holds the rights to use any entity of the Pictet group trademarks. For illustrative purposes only.
Cookie Policy
This website uses cookies to enhance user navigation and to collect statistical data. To refuse the use of cookies, change your settings or for more information, please click on the following link: Cookies policy. By continuing to browse this website, you accept the use of cookies for the above purposes.