The inversion of the US yield curve strengthens the bear case for the economy and stock markets.
Written by
Luca Paolini
Chief Strategist
Share this article
A US recession and flat equity markets. If history is any guide, that is what the inverted US yield curve is forecasting.
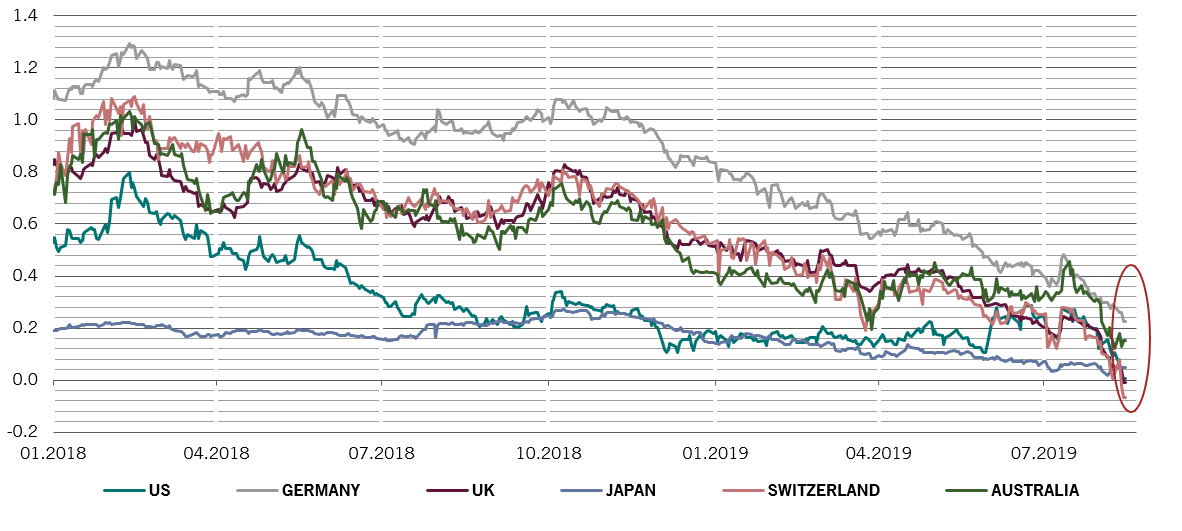
Yields on benchmark 10-year Treasury bonds have this month fallen below those on 2-year paper for the first time since 2008. That follows an inversion of another part of the curve earlier in the year. The trend isn’t limited to the US either – UK and Swiss curves are also inverted, while Japan is a whisker away (see chart).
turning negative
Yield spread between 10-year and 2-year government bonds, ppts
Source: Refintiv. Data covering period 01.08.2018-14.08.2019.
According to our research, that means storm clouds are gathering both for the economy and for equity markets. That's because an inverted (or flattening) yield curve has historically proved a reliable predictor of recessions and bear markets in stocks. In the US, for instance, each of the last seven slumps has been preceded by an inversion of the curve.
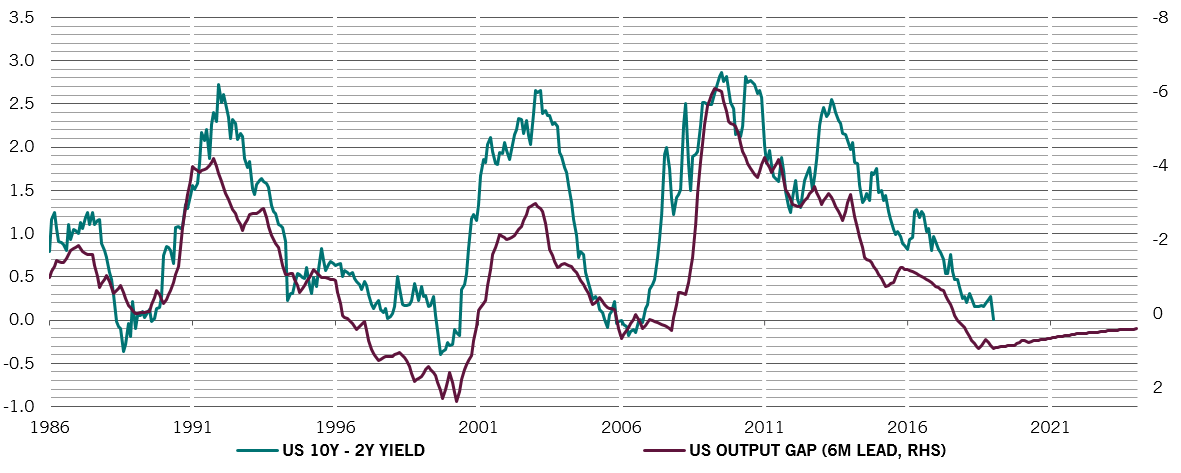
A US recession typically occurs 1 year after the inversion of the yield curve between 10 and 2 year bonds. That’s because the yield curve has historically been very closely correlated with the output gap – the difference between an economy's current rate of growth and its long-term potential (see chart).
lessons from history
Yield spread between 10-year and 2-year Treasury bonds and US output gap, ppts
Source: Refinitiv. Data covering period 14.08.1986-14.08.2024.
If precedent holds, US economic growth is set to decelerate significantly – according to our analysis the curve implies an average real GDP growth of about 1 per cent over the next five years. That average, in turn, likely hides a period of economic contraction.
All of which is bad news for equity markets. Every bull market has started and ended with a US recovery and a US recession since 1950 – and we’ve had 10 recessions since then. This suggests that a major market peak is likely within the next 12 months.
Although the yield curve is just one of a number of variables we use in our asset class return forecast model, the negative spread between the 10-year and 2-year US bond yields indicates US equities could deliver as little as 2 per cent per year over the next five years in nominal terms. That's only marginally below the forecasts in our Secular Outlook and down from an annualised return of about 10 per cent during the previous five years. Factor in inflation, and real returns will be around zero.
In other words, the US yield curve is telling us that the S&P 500 in 5 years’ time will be around 3,000, almost unchanged from current levels. This doesn’t mean the market will flat-line over the whole period. Instead, there’s likely to be considerable volatility – another typical consequence of an inverted yield curve.
An inverted yield curve is consistent with the VIX index – a measure of expected volatility of US equities, based on options pricing – to rise around 30 per cent over the next two years.
What does this mean for investors? Strategically, this is the right time to reduce allocation to equities. Tactically, the market could offer a final “entry point” in this cycle, but the upside is limited in both time and size.
Luca Paolini joined Pictet Asset Management in
2012 as Chief Strategist. Before joining Pictet, Luca worked as an Equity
Strategist at Credit Suisse Securities, responsible
for asset, regional and sector allocation. From
2005 to 2007, he was Investment Strategist at
Union Investment. Luca started his career in 2001
at Allianz Dresdner Asset Management as a
assistant vice president, covering asset allocation
and investment strategy.
Luca holds a Master degree in International
Economics and Management from SDA Bocconi
School of Management in Milan, and a Laurea
Magistrale in Political Sciences from the University
of Bologna.
Share this article
Important legal information
This marketing material is issued by Pictet Asset Management (Europe) S.A.. It is neither directed to, nor intended for distribution or use by, any person or entity who is a citizen or resident of, or domiciled or located in, any locality, state, country or jurisdiction where such distribution, publication, availability or use would be contrary to law or regulation. The latest version of the fund‘s prospectus, Pre-Contractual Template (PCT) when applicable, Key Information Document (KID), annual and semi-annual reports must be read before investing. They are available free of charge in English on www.assetmanagement.pictet or in paper copy at Pictet Asset Management (Europe) S.A., 6B, rue du Fort Niedergruenewald, L-2226 Luxembourg, or at the office of the fund local agent, distributor or centralizing agent if any.
The KID is also available in the local language of each country where the compartment is registered. The prospectus, the PCT when applicable, and the annual and semi-annual reports may also be available in other languages, please refer to the website for other available languages. Only the latest version of these documents may be relied upon as the basis for investment decisions.
The summary of investor rights (in English and in the different languages of our website) is available here and at www.assetmanagement.pictet under the heading "Resources", at the bottom of the page.
The list of countries where the fund is registered can be obtained at all times from Pictet Asset Management (Europe) S.A., which may decide to terminate the arrangements made for the marketing of the fund or compartments of the fund in any given country.
The information and data presented in this document are not to be considered as an offer or solicitation to buy, sell or subscribe to any securities or financial instruments or services.
Information, opinions and estimates contained in this document reflect a judgment at the original date of publication and are subject to change without notice. The management company has not taken any steps to ensure that the securities referred to in this document are suitable for any particular investor and this document is not to be relied upon in substitution for the exercise of independent judgment. Tax treatment depends on the individual circumstances of each investor and may be subject to change in the future. Before making any investment decision, investors are recommended to ascertain if this investment is suitable for them in light of their financial knowledge and experience, investment goals and financial situation, or to obtain specific advice from an industry professional.
The value and income of any of the securities or financial instruments mentioned in this document may fall as well as rise and, as a consequence, investors may receive back less than originally invested.
The investment guidelines are internal guidelines which are subject to change at any time and without any notice within the limits of the fund's prospectus.
The mentioned financial instruments are provided for illustrative purposes only and shall not be considered as a direct offering, investment recommendation or investment advice. Reference to a specific security is not a recommendation to buy or sell that security. Effective allocations are subject to change and may have changed since the date of the marketing material.
Past performance is not a guarantee or a reliable indicator of future performance. Performance data does not include the commissions and fees charged at the time of subscribing for or redeeming shares.
Any index data referenced herein remains the property of the Data Vendor. Data Vendor Disclaimers are available on assetmanagement.pictet in the “Resources” section of the footer.
This document is a marketing communication issued by Pictet Asset Management and is not in scope for any MiFID II/MiFIR requirements specifically related to investment research. This material does not contain sufficient information to support an investment decision and it should not be relied upon by you in evaluating the merits of investing in any products or services offered or distributed by Pictet Asset Management.
Pictet AM has not acquired any rights or license to reproduce the trademarks, logos or images set out in this document except that it holds the rights to use any entity of the Pictet group trademarks. For illustrative purposes only.
Cookie Policy
This website uses cookies to enhance user navigation and to collect statistical data. To refuse the use of cookies, change your settings or for more information, please click on the following link: Cookies policy. By continuing to browse this website, you accept the use of cookies for the above purposes.