I am Article Layout

Now Reading: Barometer: Geopolitical risks cast shadow over stocks

Select your investor profile:

This content is only for the selected type of investor.

Barometer of financial markets November outlook

November 2023
Marketing Material

Barometer: Geopolitical risks cast shadow over stocks

The conflict in the Middle East threatens to further destabilise the economy and financial markets. As a result, we remain neutral stocks and overweight bonds.

01

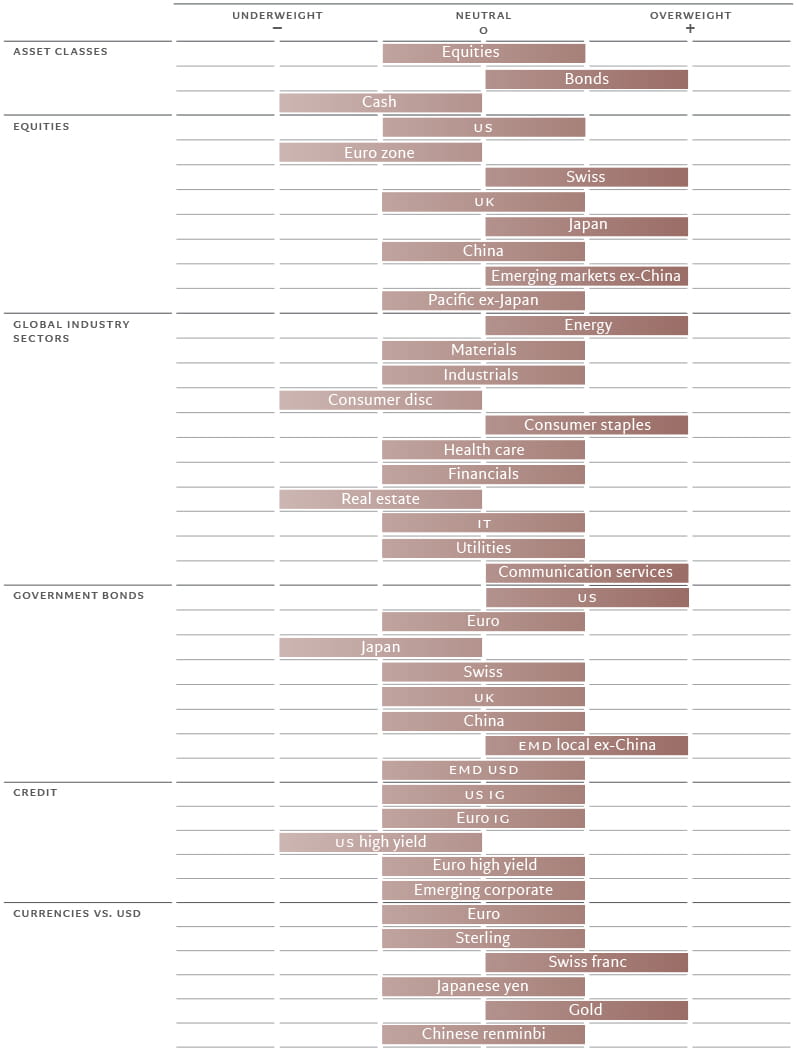
Asset allocation: geopolitical vulnerabilities

Just as the markets had started taking the Ukraine-Russian war in their stride, the latest grim developments in the Middle East remind investors of how quickly geopolitical crisis can boil up. The conflict in Gaza comes at a point when economies are looking vulnerable.

The US is in our view at the cusp of slowing significantly as US Federal Reserve rate hikes of the past year feed through to consumers. And though the Chinese economy looks like it has troughed, sentiment there remains depressed. Elsewhere, Europe’s resurgence is slow in coming. As a consequence we remain neutral equities. Valuations for stocks may be more palatable following the market’s recent pull-back and corporate earnings look resilient for now, but muted economic growth means there’s no compelling case to buy. 

Our defensive stance is reinforced by our overweight in bonds. 

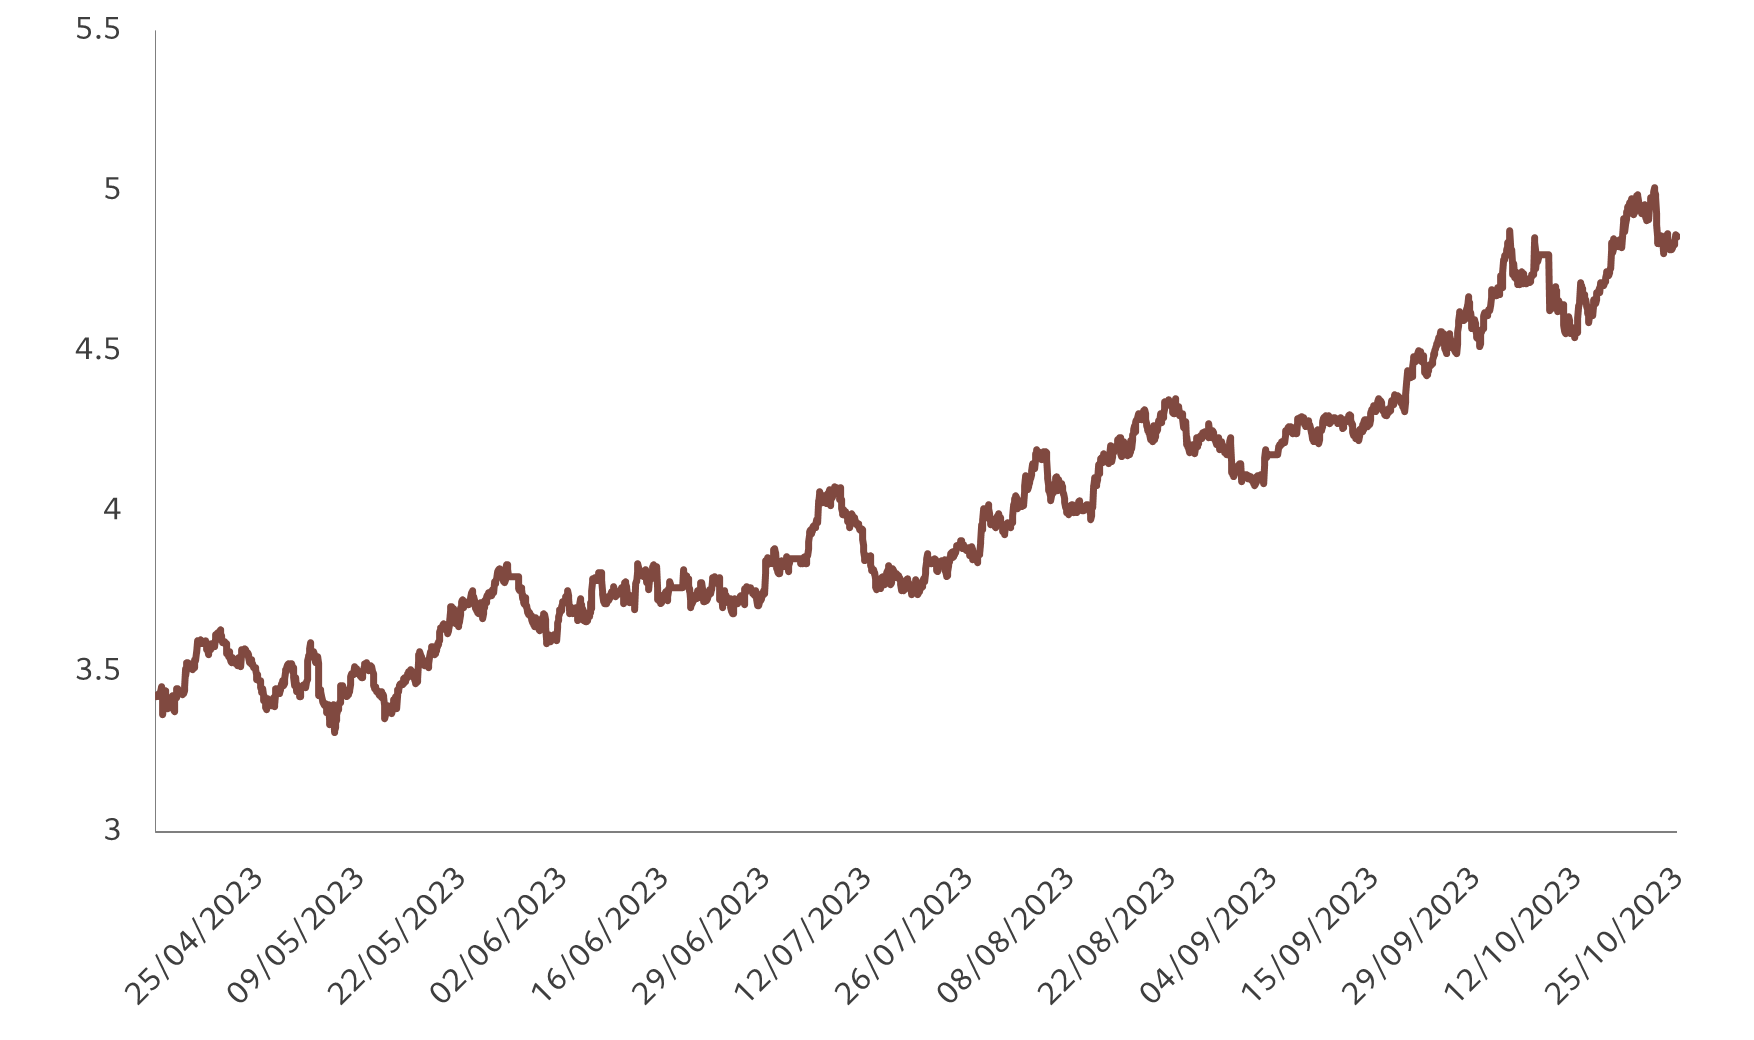
Fixed income markets have suffered significant upheaval this year and the prospect of a surge in government bond supply is a growing worry given substantial public sector deficits, particularly in the US. Yet with bonds offering the most attractive yields for many years – they hit 5 per cent on 10-year US Treasuries, while real yields are at multi-decade highs – and a likely slowdown in both growth and inflation, we continue to hold an overweight in fixed income. 

Fig 1. Monthly asset allocation grid
November 2023
Barometer-November-2023-grid_EN
Source: Pictet Asset Management

Our business cycle indicators show that while emerging market economies remain resilient, developed markets are slowing. Within developed markets, the euro zone has better prospects than the US, although both are growing below potential. Over the short-term, the stickiness of inflation remains a concern, with headline price pressures having picked up. And should the conflict between Hamas and Israel expand beyond that immediate region, oil prices would respond. But we think overall that disinflationary forces hold sway, driven by subdued growth and easing supply chain pressures. 

We expect the US economy to slow to well below potential and this year’s current rate of rate of expansion of 1.9 per cent. That’s mostly because we expect consumption to be muted as American households work through the savings surplus they built up during Covid. The euro zone is also subdued, with countries dependent on manufacturing faring especially badly. But that should improve with China’s slow recovery. 

Japan remains the one bright spot in the developed world: we see it as the only major developed economy growing above potential in 2024. Consumer spending is strong, while governance reforms across the corporate sector are helping attract foreign capital. 

Liquidity conditions continue to diverge across the world, with the US and Europe tightening and Japan witnessing the opposite (for now); China continues to offer modest stimulus. 

In the US, higher real rates are proving a drag on loan-making. Also inhibiting the flow of credit is a pick up in the pace of quantitative tightening by the Fed and an increase in issuance of US government securities to cover the country’s significant budget deficit. Net US bond issuance is likely to come to USD300-500bn per quarter for the current quarter and quarters to come, compared to less than USD200bn during the previous quarter. Debt servicing costs will further add to the upward pressure.

Elsewhere, China’s flirtation with deflation could prompt Chinese authorities into taking a more aggressive monetary stance. Meanwhile in Japan, there are signs that a move towards tightening is imminent, though timing is a question. 

Fig. 2 - Not so nifty
Performance of US equities ex-big 7 stocks vs US aggregate fixed income
*Top 7 by current market cap: AAPL, MSFT, AMZN, GOOG, NVDA, META, TSLA.
Source: Refinitiv, MSCI, IBES, Pictet Asset Management. Data covering period 31.12.2021 to 25.10.2023.

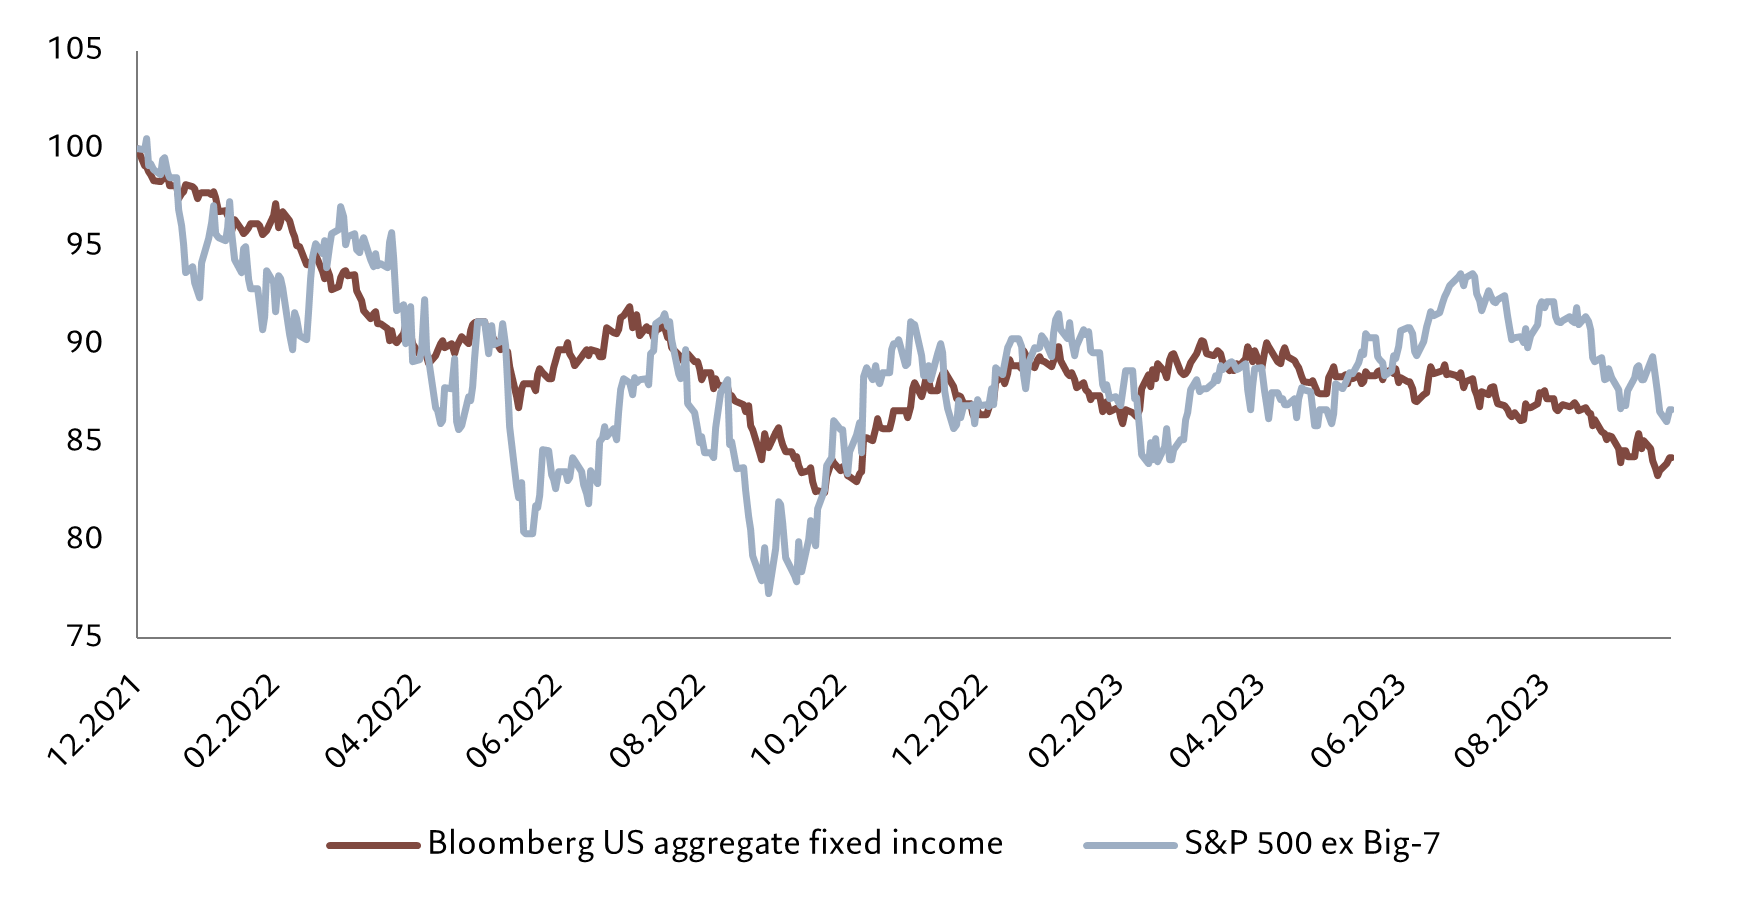
Our valuation metrics clearly favour bonds over equities, not least because of a recent jump in yields. US equity price-earnings (PE) multiples remain above our model estimate. The 12-month price to earnings (PE) ratio for the market is 12 per cent above our secular fair value forecast of 16 times. The ‘Magnificent 7’ tech stocks that had been dominating the equity market’s performance, weakened somewhat, but are still on a rich forward PE of 28 times, which represents an 80 per cent premium to the rest of the market.  But the rest of the market has tracked developments in bond yields (see Fig. 2).

Relative to bonds, equities are very expensive in the US. For the first time since 2001, stocks' 12-month earnings yield is below the Fed funds rate and the gap between the earnings yield and the real bond yield is below 2 per cent. This has only happened four times in the past half-century.

Our technical indicators show weakening trends for equities, led by declining momentum in Japan and a deterioration in the euro zone. Seasonality remains favourable for the market over the next month, however. The bond trend has also deteriorated. Sentiment remains weak, suggesting oversold conditions for eurozone and Chinese equities. Within fixed income, high yield credit and emerging market hard currency bonds also look oversold. 

02

Equities regions and sectors: the hunt for quality and defence

Fresh conflicts in the Middle East and the ongoing war in Europe have combined to increase uncertainty for investors already worried about interest rates remaining higher for longer. In such times, investors would be better off holding companies with high profitability, good earnings visibility and low leverage – what typically qualify as quality stocks.1

These stocks have outperformed their growth counterparts, or those which are sensitive to ups and downs of the business cycle, in the past couple of years (see Fig. 3). 

Swiss stocks should therefore prove to be a bright spot in the coming months as the country has the highest share of defensive – which largely fall under the quality umbrella – stocks among major economies -- at 60 per cent of the Swiss benchmark index’s market capitalisation. These are mainly pharmaceuticals and consumer staple businesses. We remain overweight the country’s stocks, whose valuations remain reasonable.

We also remain overweight Japanese stocks too. Many Japanese companies benefit from strong earnings dynamics, and we expect the market to deliver earnings growth of just over 10 per cent this year, the highest of any developed economy and rivalling the pace of growth we forecast within emerging markets.  We are also enthused by new measures aimed at improving corporate governance in Japan 

Our investment case for Japanese equity looks stronger still when the focus shifts to technical factors.  Investor positioning in Japanese stock markets is not overly heavy yet: Japan-dedicated funds have attracted inflows of just USD9 billion in the past 13 weeks .

Fig. 3 - Quality preferred
MSCI World Quality and Growth relative performance
Equities
Source: Refinitiv, Pictet Asset Management. Data covering period 23.10.2020 to 25.10.2023.

Our overweight stance on emerging economies – outside of China – remains unchanged as the emerging world has better growth prospects than its developed counterpart.

We are less positive on euro zone stocks. The region’s growth outlook remains weak and the central bank is likely to remain hawkish given upward pressure on prices through strong wage growth. At the same time, European corporate profit margins look vulnerable.

When it comes to sectors, we are overweight energy – a defensive move in the light of heightened geopolitical tensions. 

Our defensive stance is further reinforced by an underweight in consumer discretionary and an overweight in consumer staples.

We see evidence that consumers – particularly those in the US - are spending excess savings built up during the pandemic at a faster pace than we previously thought, which points to a future downturn in retail spending. In the US for example, cumulative excess savings have fallen by two thirds since hitting a peak of around USD1.8 trillion in August 2021. At this rate, consumers will run out of these buffers by mid-2024.

We continue to hold an overweight position in communication services. The sector offers exposure to companies that have strong balance sheets and trade at reasonable valuations. In contrast, we remain neutral on technology. Earnings from big tech companies have been more disappointing than not, although the sector is supported by strong secular trends such as the growing use of artificial intelligence the hurdle for upside surprises is very high.

03

Fixed income and currencies: treasuring US Treasuries

The sell-off in US government bonds has gone too far. Ten-year yields on US Treasuries have hit a 16-year peak of above 5 per cent, some 100 basis points higher than our fair value estimate of approximately 4 per cent. 

At a time when the world’s largest economy looks set to slow and geopolitical risks are mounting, yields of this magnitude look very attractive for any investor looking to shore up their defences. Our model classifies US government bonds as cheap, the first time it has done so since June 2021. For these reasons, we retain our overweight on US Treasuries. 

We also remain overweight in emerging market local currency bonds. The asset class has already benefited from interest rate cuts by developing central banks. But the prospect of an appreciation in emerging market currencies means such bonds could gain even more, especially when emerging economies are likely to outgrow their developed peers.

Fig. 4 - Gold shines
Gold price vs US real rates and dollar
Fixed income
Source: Refinitiv, Pictet Asset Management. Data covering period 01.04.2022 to 25.10.2023.

By contrast, we remain underweight Japanese government bonds. Inflation is still rising in the world’s third largest economy, which is also experiencing strong growth. This suggests that the Bank of Japan will have no choice but to exit what is an increasingly unsustainable easy monetary policy by raising interest rates in the coming months.

In credit, we are underweight US high yield bonds. Default rates will likely climb from current low levels in line with tighter lending standards. 

Gold is likely to benefit from falling US real rates and a weaker dollar in our view through the year ahead. While its resilience so far and the sharp ascent in the wake of the Israel-Hamas conflict has made valuation challenging (see Fig. 4), we remain overweight.

Although the dollar has held up well, supported by the currency’s yield advantage over its developed market peers, it faces the prospect of a sustained decline thanks to what we see as a deterioration in the US’s economic fundamentals: we expect US GDP growth to fall behind that of most of its peers in 2024.

Elsewhere, we are overweight the Swiss franc, a safe-haven currency that benefits from favourable domestic inflation dynamics.

04

Global markets overview: red October

October was a tough month for global markets, with most asset classes finishing firmly in the red.

Increased geopolitical tensions, particularly in the Middle East, higher market volatility and mixed earnings news all dampened investor sentiment. Equities lost 2.7 per cent, in aggregate, in local currency terms. The weakness was widespread, spanning across all major regions and affecting both developed and emerging markets.

Although third quarter results for both S&P 500 and STOXX 600 companies have so far beaten expectations, revenue growth has been muted and guidance for the future has remained largely unchanged.

An 8 per cent drop in oil prices dragged down energy stocks. Concerns about economic growth, meanwhile, weighed on cyclical sectors such as industrials, consumer discretionary and materials. Even the IT sector – this year’s star performer – finished the month in the red, albeit by a relatively modest 0.8 per cent. Utilities was the only sector to eke out a small positive return.

Fig. 5 - Up, up and away
US 10-year Treasury bond yields, %
Markets
Source: Bloomberg, Pictet Asset Management. Data from 12.04.2023 to 25.10.2023.

Global bonds weakened, down 0.9 per cent for the month. Losses were particularly notable for US Treasuries, with 10-year Treasury yields crossing the 5 per cent level for the first time in 16 years (see Fig 5). The sell-off was triggered by a combination of resilient economic data (which reduced the likelihood of rate cuts in the near future) and by the Treasury’s plans for sizeable future issuance to fund a widening budget deficit.

The dollar lost its upward momentum in October, but still remained supported by a growing yield advantage over its developed market peers.

Heightened risk aversion proved a boon for safe haven gold, which jumped 7.5 per cent on the month.

05

In brief

Barometer November 2023

Asset allocation

We retain our overweight in bonds but remain neutral equities amid elevated geopolitical risks and slowing economic growth

Equities regions and sectors

We continue to prefer quality and defensive stocks, and retain our overweight in consumer staples and the Swiss market

Fixed income and currencies

We retain our overweight in US Treasury bonds and emerging market local currency bonds.