What caught our eye
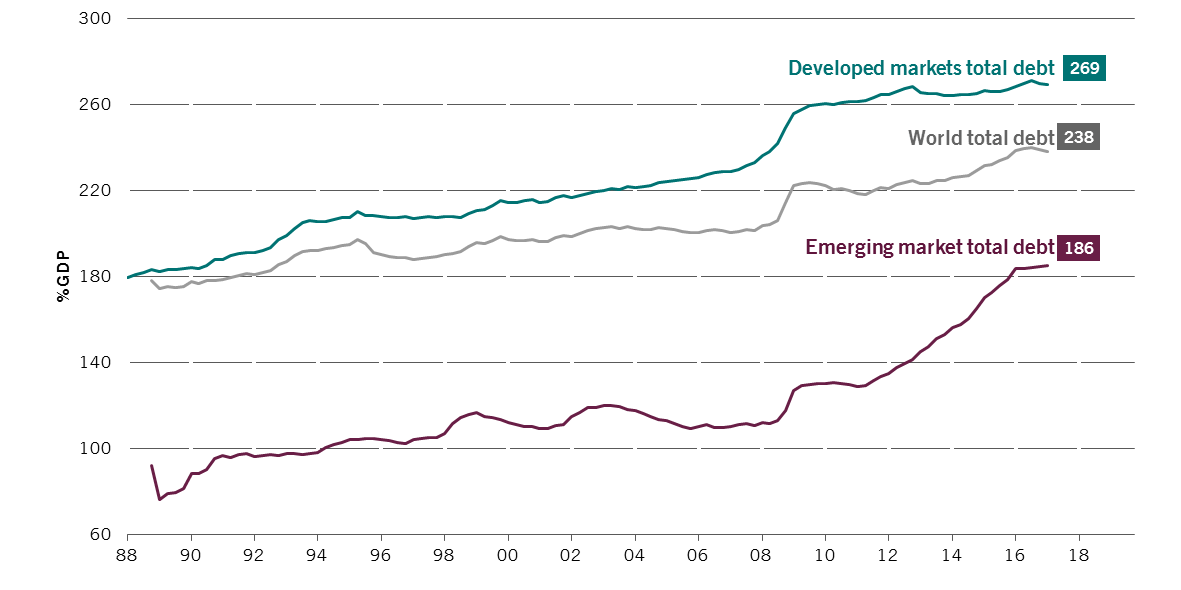
Total debt in emerging markets has risen strongly since the 2008 financial crisis to reach a high of 186% of GDP in Q1 2017. It is corporate sector debt in particular that has driven the increase, accounting for over half of the total.
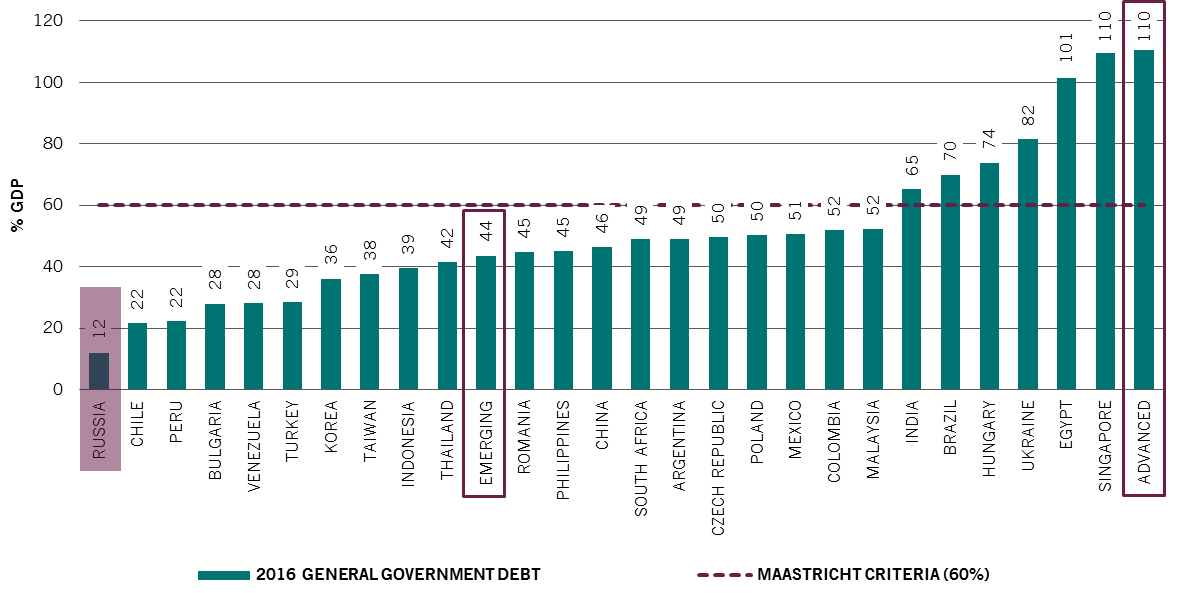
% GDP
Mind the (China) gap
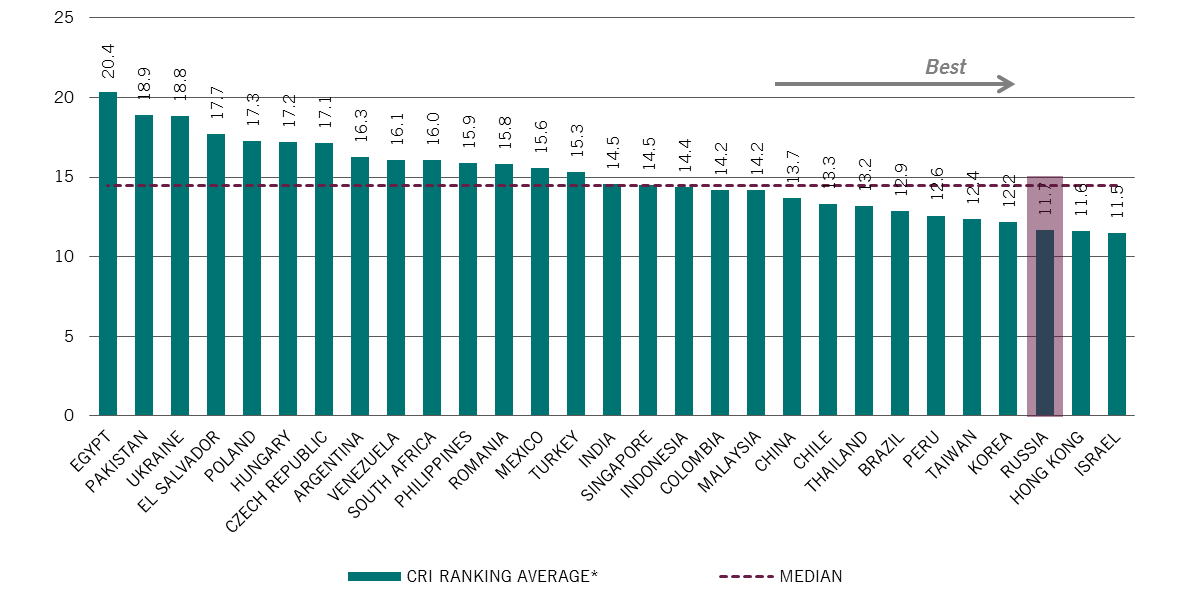
We use a methodology from the Bank for International Settlements (BIS) to identify the long-term trend of the debt-to-GDP ratio. Subtracting this long-term ratio from the current debt-to-GDP ratio gives the excess debt of a market (also called the debt gap). The chart below shows the debt gap* of leading emerging markets.
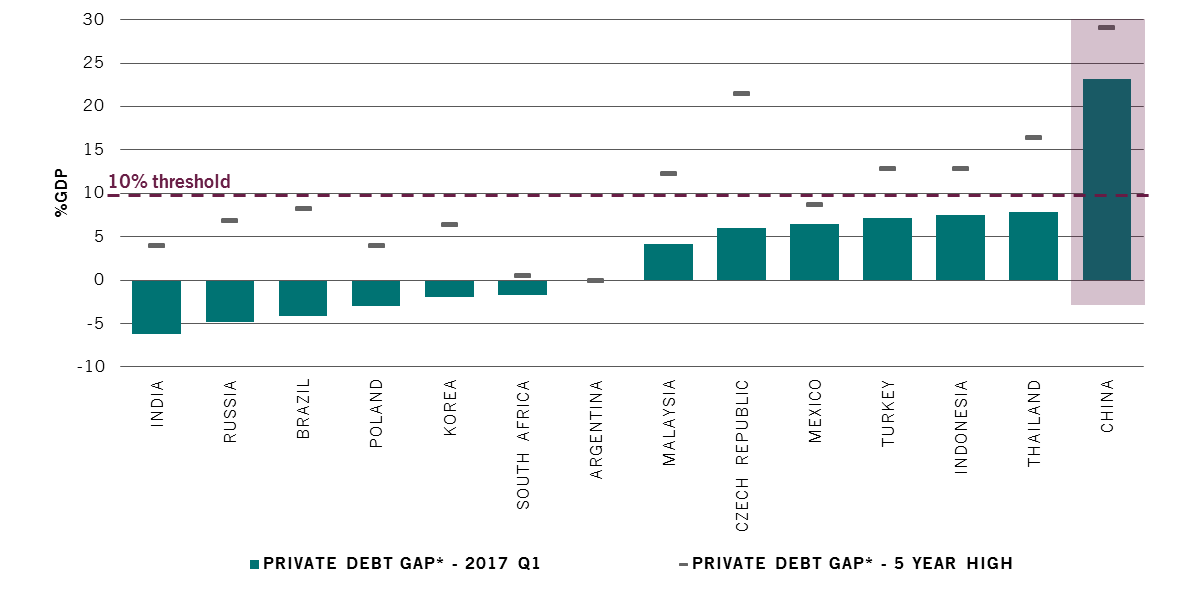
A debt gap above 10% is a level beyond which the risk of financial crisis rises significantly. Fortunately almost all major emerging markets are below this threshold, especially compared to five years ago.
The only exception is China, where we do not expect a major crisis (read our article).
Watch out for the 'CADs'
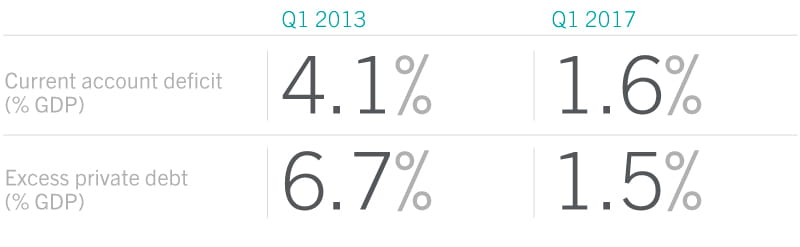
Excess debt becomes an even bigger problem if it needs to be financed externally, i.e. if a country has a current account deficit (CAD).
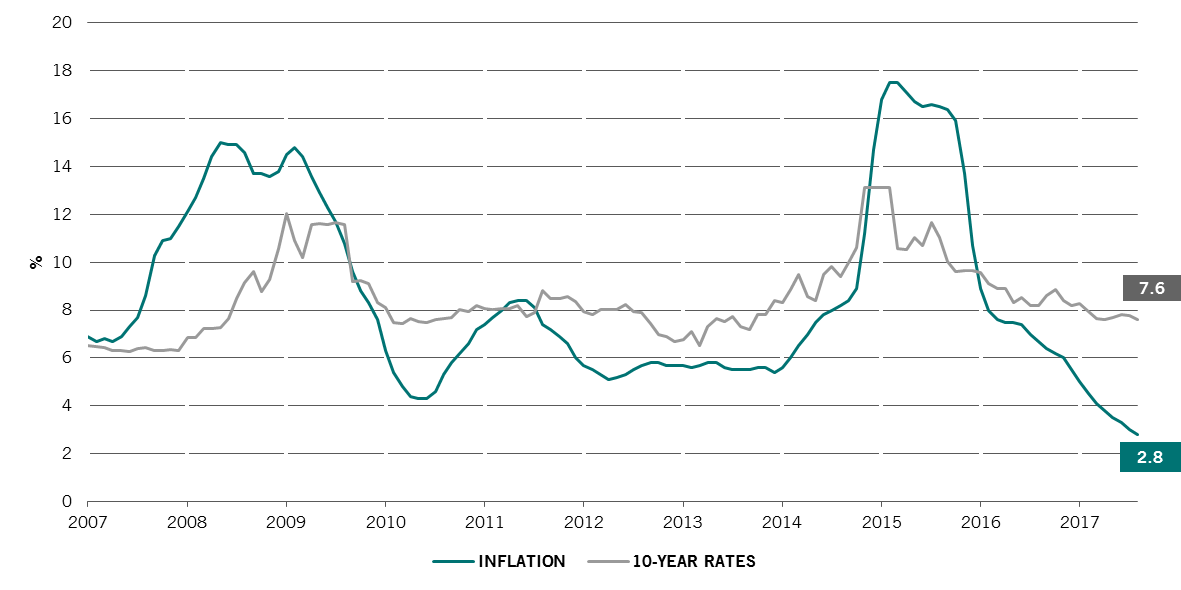
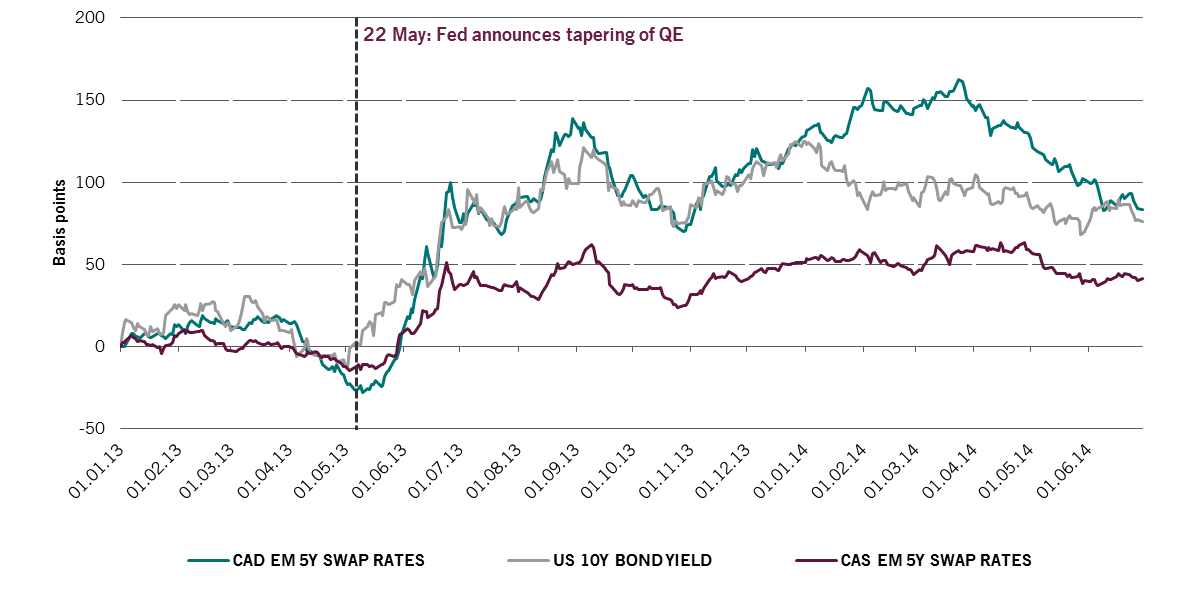
Looking back in the chart below at the 2013 taper tantrum—a key episode for emerging market assets—5-year swap rates for emerging CAD countries (the green line) sold off in line with the US 10 year bond yields, selling off even further through early 2014.
By contrast, current account surplus countries (CAS) saw their swap rates remain far more resilient and stay inside the US 10 year yield, with a spread increase of only around 50bps.
The same trend was seen in the currency markets over this period, with CAD currencies depreciating by an average of 15%, but CAS countries by only 3%.
EM CAD & CAS swap rates & US 10 year bond yield (2013-2014)
Are things different now?
Average of key current account deficit emerging markets in 2013 and 2017
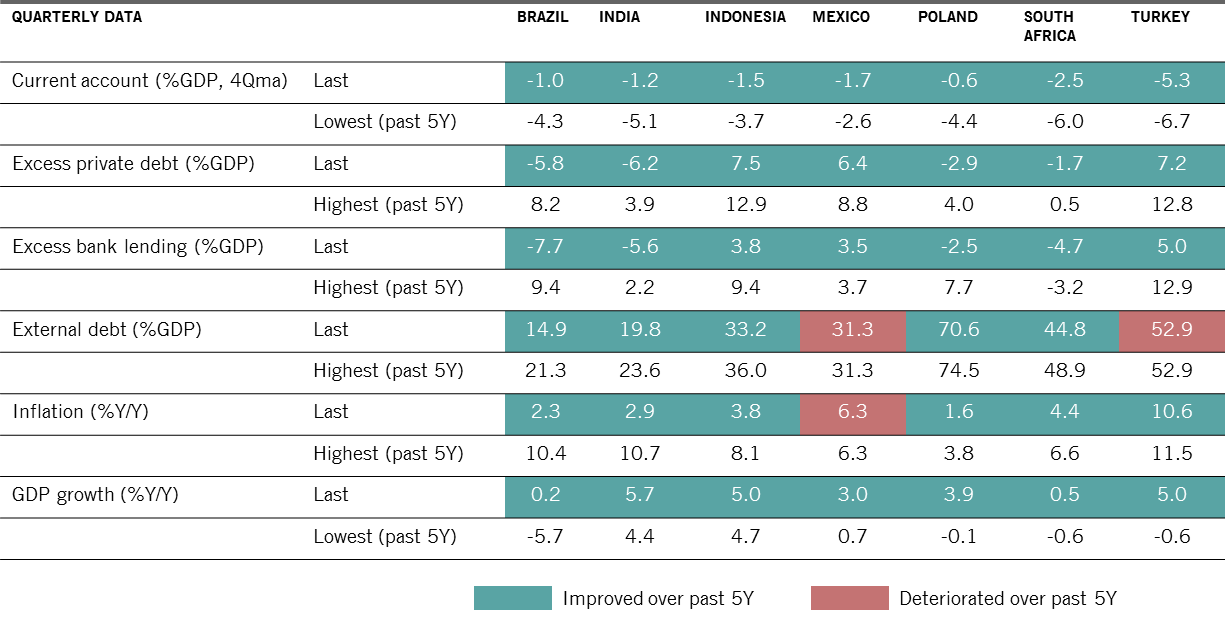
There are exceptions, notably Turkey which still has a high current account deficit (5.3% of GDP) and high inflation rate (>10% y/y).
Overall though, we do not believe the emerging market complex is heading for a major correction as US yields continue to rise.
Related macroeconomic data for CAD emerging markets
As at 30/09/2017