The sell-off in EM currencies since mid-April is not comparable to the 2013 taper tantrum. Has it gone too far?
Written by
Patrick Zweifel
Chief Economist
Share this article
In our view, the sell-off in EM currencies since mid-April is not comparable to the 2013 taper tantrum that was triggered by a classic balance-of-payments crisis. Rather, we think it is due to four global, idiosyncratic factors that impact the currencies of both current-account-deficit (CAD) and current-account-surplus (CAS) countries:
Rising global rates/stronger USD (affecting mostly CAD)
Trade tensions (affecting mostly CAS)
Renminbi (RMB) contagion (affecting CAS & commodity exporters)
Rising populism (affecting all)
Is the correction in EM currencies justified?
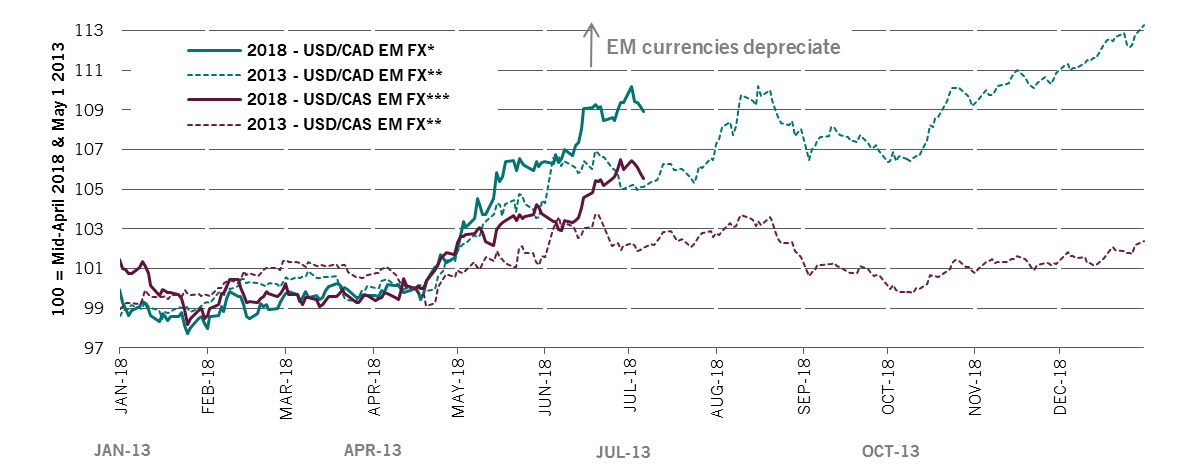
Observation 1 - A broad sell-off
EM currencies have lost 10 per cent this year, compared with 4 per cent in 2013 (Fig.1). The main difference with the 2013 taper tantrum is that the sell-off is broad-based, hitting both deficit and surplus countries.
Countries running a current account surplus have not been sheltered from the sell-off, but this is no contagion. We think it is due to trade tensions, and exposure to China and a weak renminbi.
Fig.1 - Both deficit and surplus countries have been hit this time round
USD vs. CAD & CAS emerging-market currencies (2018 vs. 2013 taper tantrum)
Source: Pictet Asset Management, CEIC, Datastream. 2018 data to 06.07.2018; 2013 data to 30.06.2014.
* 2018 CAD EM currencies: INR, IDR, PHP, ARS, BRL, CLP, COP, MXN, PEN, RON, ZAR, TRY. ** 2013 CAD EM currencies: INR, IDR, THB, ARS, BRL, CLP, COP, MXN, CZK, PLN, ZAR, TRY. *** 2018 CAS EM currencies: CNY, KRW, MYR, SGD, THB, TWD, CZK, HUF, ILS, PLN, RUB. ** 2013 CAS EM currencies: CNY, KRW, MYR, PHP, SGD, TWD, HUF, ILS, RUB.
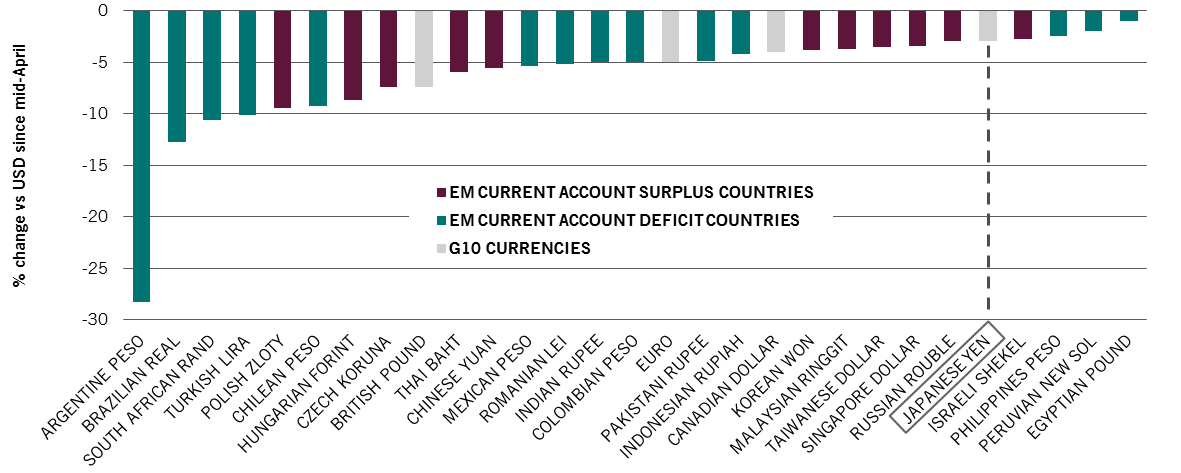
Observation 2 - Current account positions are much stronger across the board than 5 years ago
Unlike 2013, there are significant differences between countries. While some EM currencies have outperformed the most resilient of the G10 currencies, the yen, the worst performers are four main deficit countries' currencies, led by the Argentine peso (Fig.2).
Fig.2 - Not all EM currencies have depreciated to the same extent
EM CAD & CAS countries' currencies change (YTD)
Source: Pictet Asset Management, CEIC, Datastream, July 2018
However, although countries with larger current account deficits (a proxy for higher external financing needs) typically have weaker currencies, not all CAD countries have seen their currencies depreciate as heavily this time. The main culprits are Argentina and Turkey, which exhibit genuine balance-of-payments fragility.
A point to note is that the two countries are the exception - current account deficit countries have sharply reduced their external financing needs, and appear much better placed to cope with higher rates.
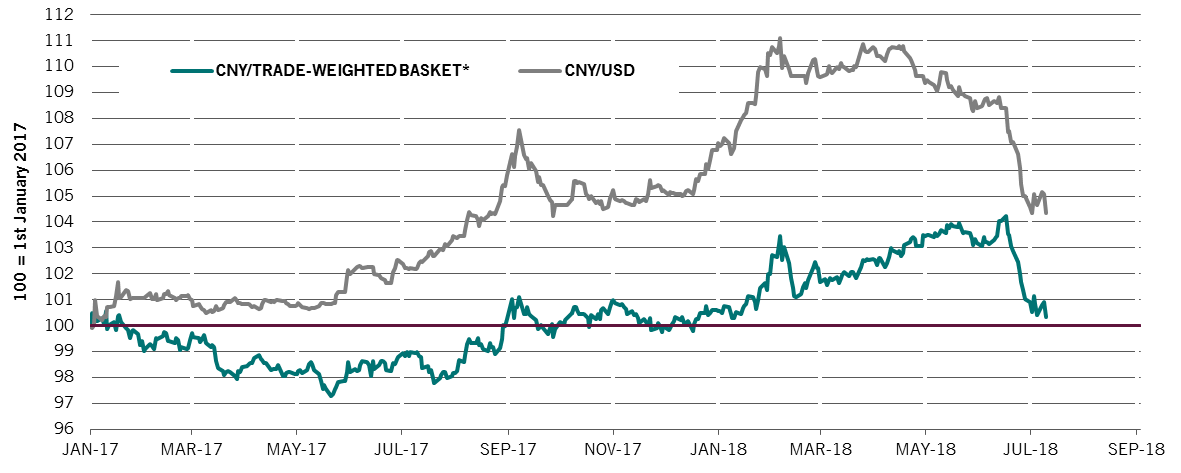
Observation 3 - No contagion to fear from China
Admittedly linked to trade tensions, the weakness of the renminbi (RMB) comes after Chinese authorities allowed the currency to appreciate by some 4 per cent (Fig.3) versus its trade-weighted basket of currencies. We think it is a welcome catch-up against main trade partners.
Fig. 3 - Renminbi - back to January 2018 level
Renminbi vs. trade-weighted basket of currencies
Source: Pictet Asset Management, CEIC, Datastream. Data as at 11.07.2018.
A reassuring factor is that net capital outflows have been very limited year-to-date thanks to China’s improving fundamentals. Capital controls in place are also stricter since January 2017, notably on overseas direct investment, and this has reduced the risk of capital-flight panic.
Conclusion
Many emerging countries have reduced their current account deficit in recent years, putting them in a much better position to withstand external shocks. And although growth is slowing in China, its economy's fundamentals are stronger than in 2013.
Trade-related tensions remain, and the risk of a populist government is a concern in Brazil. But in our view, the correction in emerging market currencies has gone too far.
THE VIEW FROM OUR EMERGING CORPORATE BONDS TEAM
By Karen Lam, Senior Client Portfolio Manager
In our view, local currency depreciation is not necessarily bad for emerging market companies. As shown below, it depends on the sector. But more specifically, we think it is important to look at companies on a bottom-up basis.
Fig.4 - different Industries, different levels of vulnerability to depreciating currencies
EM corporate external bond stock - Industry breakdown
Source: J.P. Morgan, July 2018
For example, financial companies’ (including banks) foreign currency liabilities are generally matched with assets or hedged, making them less vulnerable to local currency fluctuations. Elsewhere in commodity-related industries, such as oil & gas and metals & mining, revenues are generally in hard currency.
On the other hand, sectors that derive most of their revenues from the domestic economy (e.g. consumer goods, telecoms and utilities) would be more vulnerable. Still, even for sectors that are traditionally seen to be ‘more vulnerable’, it depends on the individual company and bottom-up research is key (e.g. they may be hedged).
Based on our assessment, looking at sectors, we think at least 68 per cent of the investment universe should not be hit by depreciating local currencies.
CHART OF THE MONTH FROM OUR EMERGING MARKET EQUITY TEAM
By Avo Ora, Head of Asia (ex-Japan) Equities
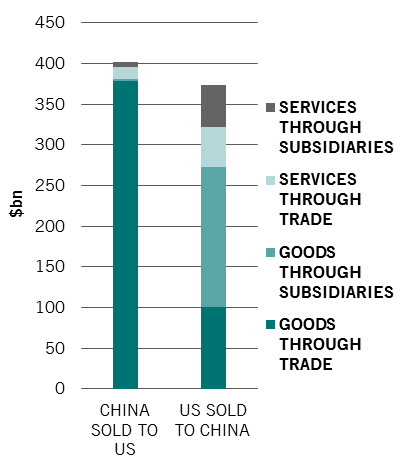
Is China strong enough to face a war with the US?
Fig.5 - China is more important to US corporate sales than one could think
Source: Deutsche Bank, BEA, China Customs, IMF CDIS, 2017
Based on official figures, the US only exports USD150 billion worth of goods to China but imports nearly USD500 billion from China, suggesting that the US has the upper hand in any trade war.
However, these figures do not include goods that are assembled - but not produced - in China. Taking these into account, US business interests in China are far greater than the official data would suggest, as shown in Fig.5.
Intuitively, when we think about the smartphone production chain and where Apple iPhones are assembled for example – this is within Asia. This cannot move to the US without corresponding large price increases on iPhones and probably a reduction in quality. In this scenario, US companies and US consumers stand to suffer the most.
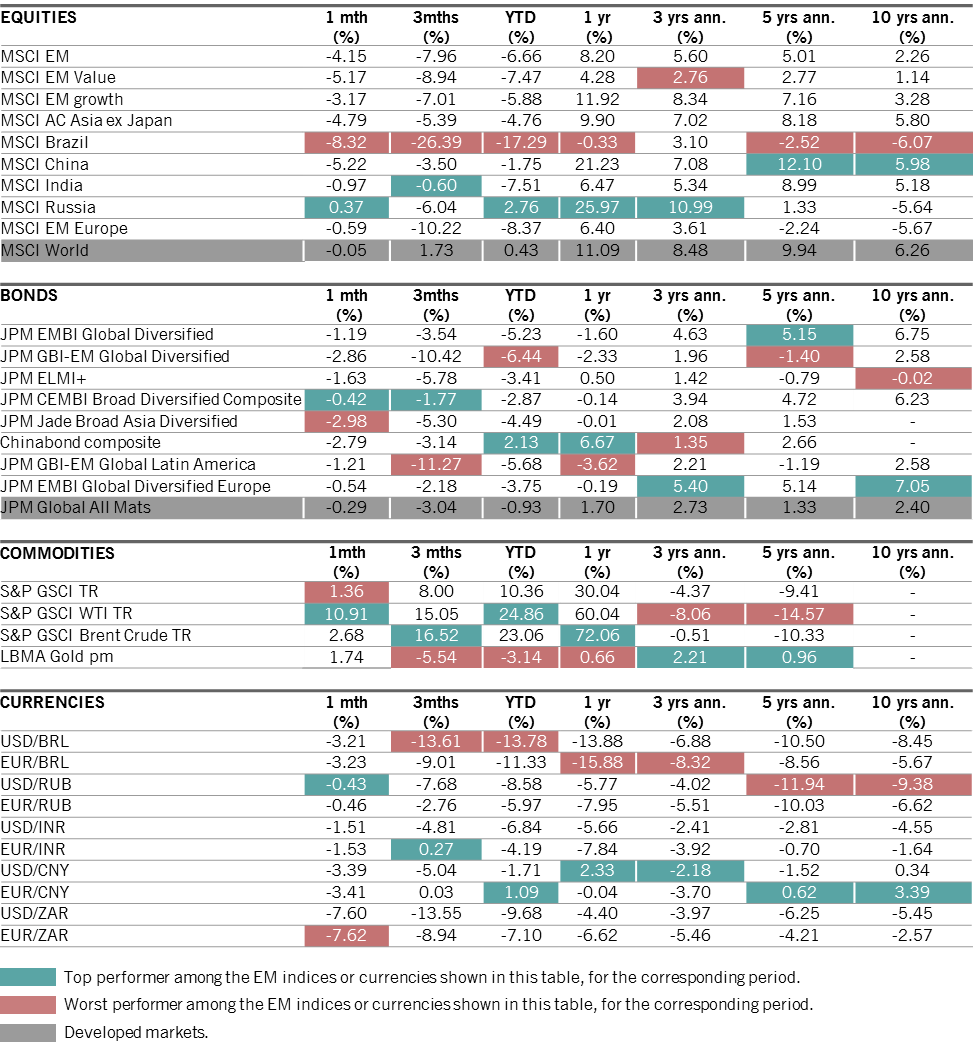
MARKET WATCH
Market watch data
30.06.2018
Source: Datastream, Bloomberg, data as at 30.06.2018 and in USD. Equity indices are quoted on a net dividend reinvested basis; bond and commodity indices are quoted on a total return basis. The currency rates evolution is treated as a performance calculation based on FX rates.
Patrick Zweifel joined Pictet in 1997. He is Chief Economist at Pictet Asset Management. Before assuming his current position in 2009, he was head of the “Macro Research Team” at Pictet Private Wealth Management. In particular, he had economic research responsibility for emerging markets and Japan, and for the development of quantitative models on major asset classes, primarily foreign exchange models. Before joining Pictet he was a research assistant in econometrics and monetary theory and worked on international research projects for the World Bank and the European Union. He holds a PhD in econometrics from the University of Lausanne.
About
Karen Lam
Karen Lam joined Pictet Asset Management in 2013 as a Senior Client Portfolio Manager in the Fixed Income Emerging Corporate team and is based in London.
Prior to joining Pictet Asset Management, Karen was an Executive Director at J.P. Morgan Asset Management working as a global rates portfolio manager and later as a senior client portfolio manager covering fixed income total return strategies and emerging market debt funds. Previously, Karen was the lead manager research analyst at J.P. Morgan Private Bank covering fixed income funds.
Karen holds an MBA from the University of Chicago Booth School of Business and an MSc in Epidemiology from Imperial College London.
About
Avo Ora
Avo Ora joined Pictet Asset Management in 2011 and is the Head of Emerging Equities. He is the Lead Portfolio Manager for the Asian Equities ex Japan strategy and the Global Emerging Markets strategy.
Prior to Pictet, he worked for Putnam where he was a portfolio manager with responsibility for Asia Pacific ex Japan strategies. He began his investment career with Putnam in 1998 as an analyst.
Avo graduated from Clark University in Massachusetts with a B.A. in International Studies and also holds a Masters in International Affairs from the Columbia School of International Public Affairs.
Share this article
Important legal information
This marketing material is issued by Pictet Asset Management (Europe) S.A.. It is neither directed to, nor intended for distribution or use by, any person or entity who is a citizen or resident of, or domiciled or located in, any locality, state, country or jurisdiction where such distribution, publication, availability or use would be contrary to law or regulation. The latest version of the fund‘s prospectus, Pre-Contractual Template (PCT) when applicable, Key Information Document (KID), annual and semi-annual reports must be read before investing. They are available free of charge in English on www.assetmanagement.pictet or in paper copy at Pictet Asset Management (Europe) S.A., 6B, rue du Fort Niedergruenewald, L-2226 Luxembourg, or at the office of the fund local agent, distributor or centralizing agent if any.
The KID is also available in the local language of each country where the compartment is registered. The prospectus, the PCT when applicable, and the annual and semi-annual reports may also be available in other languages, please refer to the website for other available languages. Only the latest version of these documents may be relied upon as the basis for investment decisions.
The summary of investor rights (in English and in the different languages of our website) is available here and at www.assetmanagement.pictet under the heading "Resources", at the bottom of the page.
The list of countries where the fund is registered can be obtained at all times from Pictet Asset Management (Europe) S.A., which may decide to terminate the arrangements made for the marketing of the fund or compartments of the fund in any given country.
The information and data presented in this document are not to be considered as an offer or solicitation to buy, sell or subscribe to any securities or financial instruments or services.
Information, opinions and estimates contained in this document reflect a judgment at the original date of publication and are subject to change without notice. The management company has not taken any steps to ensure that the securities referred to in this document are suitable for any particular investor and this document is not to be relied upon in substitution for the exercise of independent judgment. Tax treatment depends on the individual circumstances of each investor and may be subject to change in the future. Before making any investment decision, investors are recommended to ascertain if this investment is suitable for them in light of their financial knowledge and experience, investment goals and financial situation, or to obtain specific advice from an industry professional.
The value and income of any of the securities or financial instruments mentioned in this document may fall as well as rise and, as a consequence, investors may receive back less than originally invested.
The investment guidelines are internal guidelines which are subject to change at any time and without any notice within the limits of the fund's prospectus.
The mentioned financial instruments are provided for illustrative purposes only and shall not be considered as a direct offering, investment recommendation or investment advice. Reference to a specific security is not a recommendation to buy or sell that security. Effective allocations are subject to change and may have changed since the date of the marketing material.
Past performance is not a guarantee or a reliable indicator of future performance. Performance data does not include the commissions and fees charged at the time of subscribing for or redeeming shares.
Any index data referenced herein remains the property of the Data Vendor. Data Vendor Disclaimers are available on assetmanagement.pictet in the “Resources” section of the footer.
This document is a marketing communication issued by Pictet Asset Management and is not in scope for any MiFID II/MiFIR requirements specifically related to investment research. This material does not contain sufficient information to support an investment decision and it should not be relied upon by you in evaluating the merits of investing in any products or services offered or distributed by Pictet Asset Management.
Pictet AM has not acquired any rights or license to reproduce the trademarks, logos or images set out in this document except that it holds the rights to use any entity of the Pictet group trademarks. For illustrative purposes only.
Cookie Policy
This website uses cookies to enhance user navigation and to collect statistical data. To refuse the use of cookies, change your settings or for more information, please click on the following link: Cookies policy. By continuing to browse this website, you accept the use of cookies for the above purposes.