Higher for longer than you think
Investors are overly optimistic about how soon and deeply central banks will be able to cut rates. The fight against inflation isn't won yet.
Written by

Andres Sanchez Balcazar
Head of Global Bonds
US Federal Reserve Chairman Jerome Powell had only to mention that the possibility of rate cuts came up at the latest FOMC meeting for investors to be swept up by a wave of euphoria about the easy money to come. We think those expectations are overdone. Rates won’t fall as low or as quickly as the market is pricing in. This has repercussions for fixed income portfolios in particular over the coming years.
The market consensus hinges on the view that now that inflation has started to fall, it will rapidly settle at the Fed’s target of 2 per cent, allowing the central bank to slash rates dramatically. At the same time, there is a widespread expectation that the economy will avoid recession. In a nutshell, that the Fed will have engineered a soft landing.
Our analysis suggests that’s too optimistic: inflation will be stickier than the market believes. The application of the Taylor rule model, favoured by central banks to steer policy rates when inflation is elevated, suggests that the Fed will need to be significantly less bountiful than the market now expects, in order to be sure of hitting its inflation target and thereafter of keeping inflation there. A large US government deficit – it was near 6 per cent of GDP in 2023, against an average of 2.2 per cent between 1945 and 2019 – will only make it harder for the central bank to manage policy appropriately.
For investors, there’s the additional complication that although the rate cycle is turning for most developed markets, the pace at which different central banks will be able to cut will vary. Together, these factors will lead to greater dispersion of returns across sovereign bond markets, more volatile interest rates and a shorter rate cycle; that in turn will force investors to take a more tactical approach to managing fixed income.
Inflated complexity
Inflation has fallen sharply from its highs. But that doesn’t imply a swift return to target. To understand why, it’s important to analyse the sources of inflation.
Much of the surge in price pressures was due to Covid-era policies. Lockdowns and other measures designed to limit the pandemic’s impact on health had significant – and lasting – distorting effects on the global economy. Supply chains were disrupted, production bottlenecks appeared, and prices duly rose. Those effects were then compounded by Russia’s attack on Ukraine, and the consequent energy shock, particularly in Europe, which was heavily dependent on Russian gas.
Inflation has fallen sharply from last year's highs. But that doesn't imply a swift return to target.
As the global economy has returned to normal, the flow of goods – including key components like computer chips – also returned to normal and price rises have eased.
But in parallel with the supply shock, there has been a smaller, but still significant demand shock. Massive flows of fiscal stimulus in response to the pandemic made their way into people’s pockets. Those demand pressures are most evident in the non-traded sector of the economy: services. Here, prices are rising. At the same time, a strong labour market suggests that the Fed’s tightening cycle has yet to feed through to demand.
Taylor Rule rules
To determine where central bank policy should be, it's useful to look at the Taylor Rule. It has been around for decades, but is still one of the best models for guiding monetary policy when the credibility of the central bank is at stake. Its simplicity makes it all the more useful. It argues that nominal base rates should be close to nominal GDP plus or minus a coefficient that measures how far inflation is from its target and how growth is faring relative to its long-term trend.
Fig. 1 - Tayloring US rates...
US Taylor Rule rates using core personal consumption expenditure and PCE forecast vs fed funds rate, %
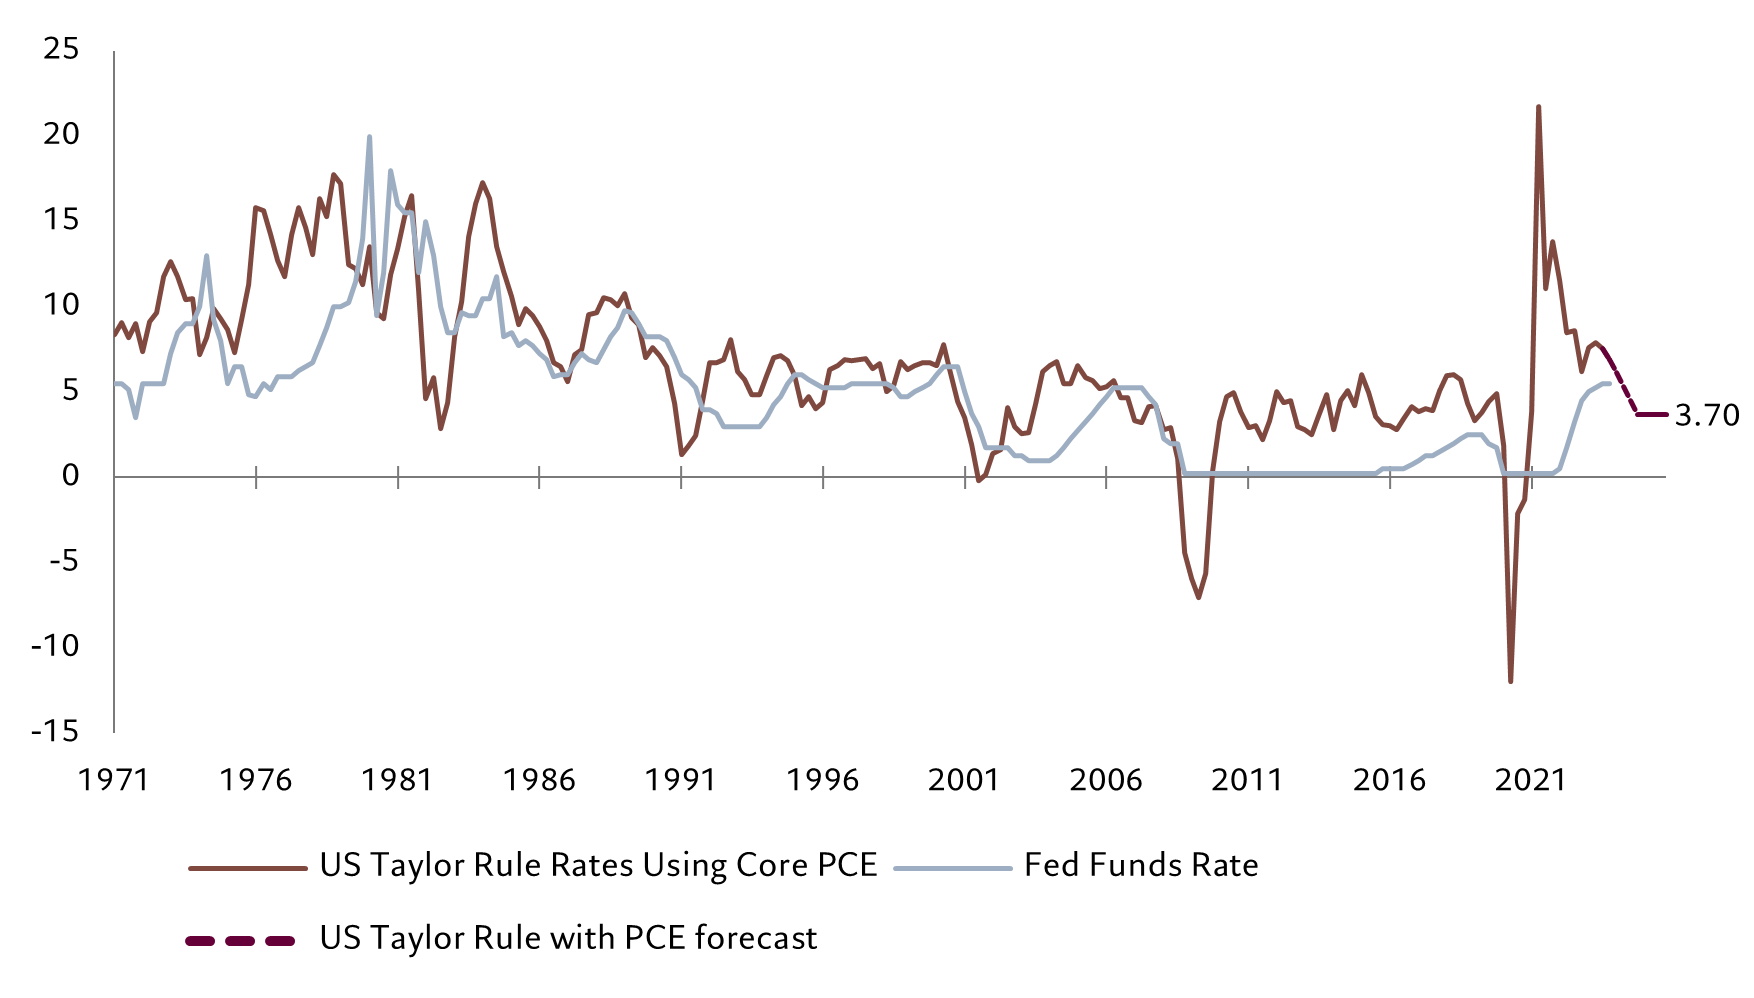
Currently, the Taylor Rule suggests that the federal funds rate should be around 6.5 per cent – against the Fed's target range of 5.25-5.50 per cent. Based on consensus forecasts for 2024 and 2025, the model says the Fed’s key interest rate should be at 3.75 per cent at the end of 2025 (see Fig. 1).
Given how much inflation has overshot central bank targets during the past couple of years, the Fed is likely to have to stick to Taylor Rule policy levels for the rest of the decade in order to shore up its inflation-fighting credibility. Assuming trend GDP growth of 2 per cent and the 2 per cent inflation target, this implies an average fed funds rate of 4 per cent for the next 5 to 7 years. By contrast, the market and the Fed expect a rate closer to 2.5 per cent.
It takes a long time for central banks to establish, or re-establish, their inflation-fighting credibility once it’s been shaken. So even if inflation returns to target by 2025 and stays there through to 2030, it will still have averaged 3 per cent during the decade – a significant overshoot of target.
Fig. 2 - ...and the euro zone's
European Taylor Rule rates based on CPI and forecast CPI vs European Central Bank deposit rate, %
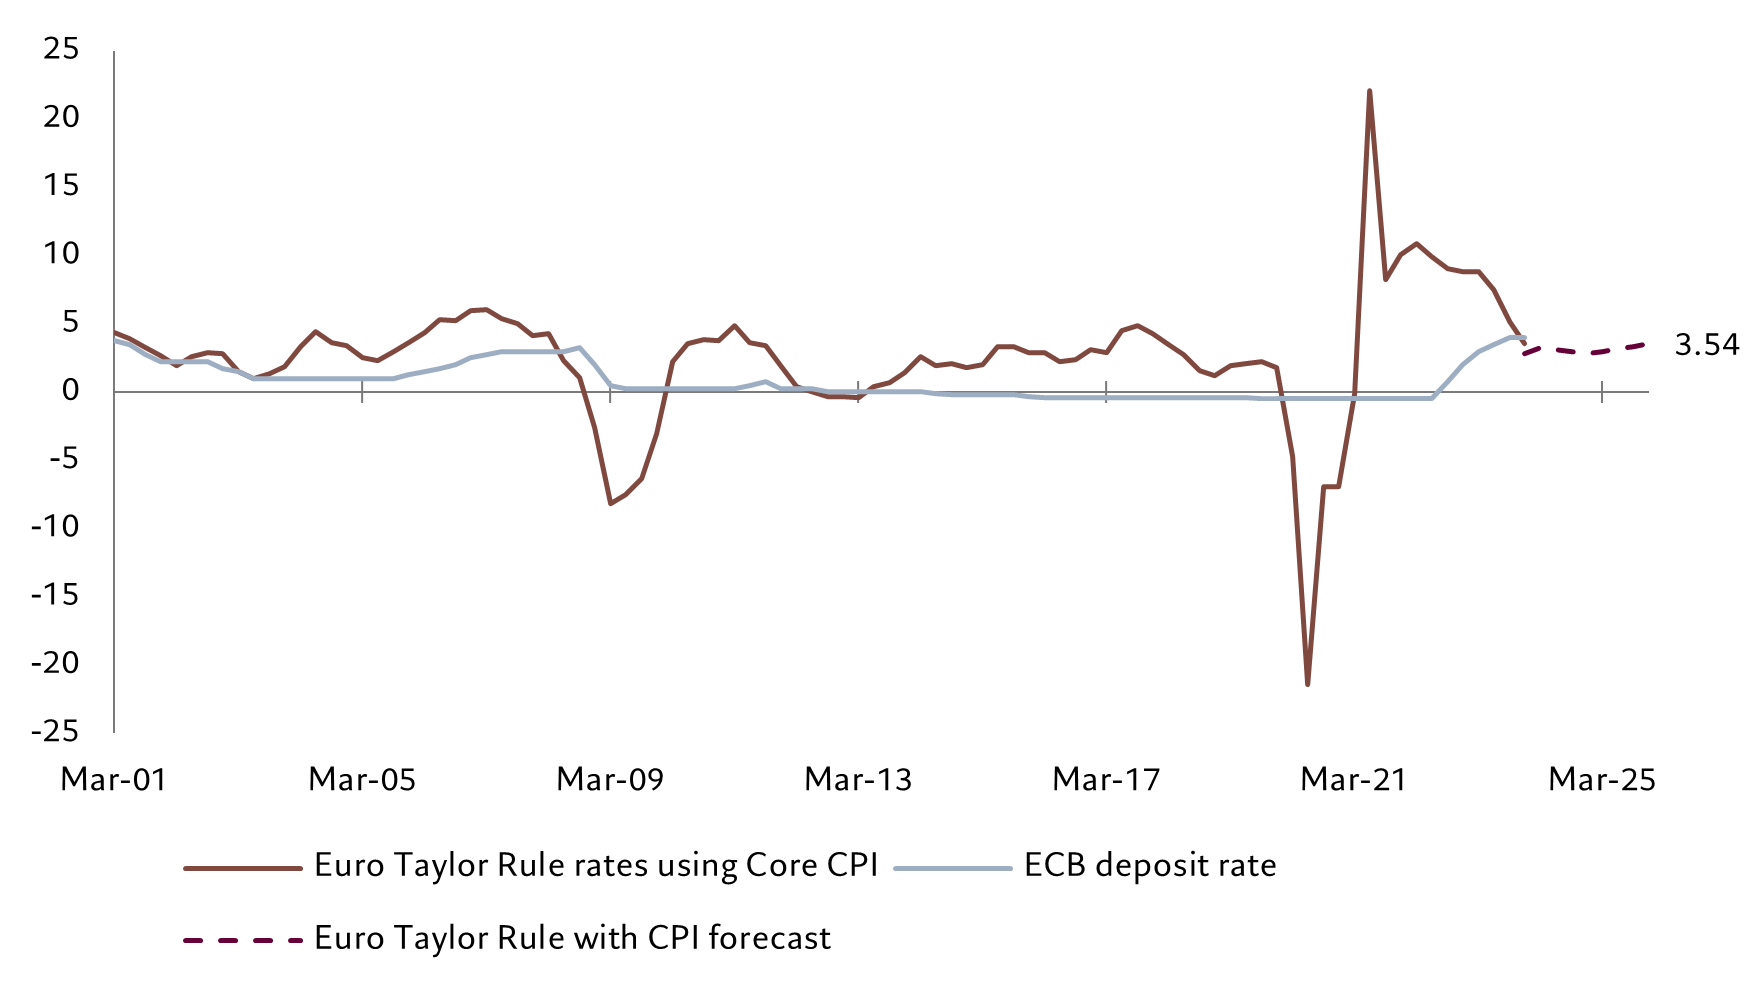
The European Central Bank is in a slightly more favourable position than the Fed. Having kept inflation close to target during the 2000s, and well below in the 2010s, the spike in consumer prices over the past couple of years is much less damaging to its inflation-fighting credibility.
A simple Taylor rule analysis suggests that the ECB’s key deposit rate should be around 5.25 per cent now, against the actual rate of 4.0 per cent, and, based on consensus forecasts for CPI and GDP growth, would need to be at 3.7 per cent by 2025 if those forecasts are right. But given its record of undershooting the target and assuming 1 per cent growth and 2 per cent inflation, we think the ECB’s deposit rate could comfortably sit at an average of 2.5 per cent for the rest of the decade (see Fig. 2).
Investing for higher for longer
In all, because they’re not sufficiently factoring in inflationary stickiness and loose fiscal policy, investors are likely to be overestimating how much central banks can ease policy and underestimating how high cash rates are likely to be in the medium and longer term. We believe that the coming cycle is likely to see rates bottom at 3 per cent in the US and 2 per cent for the ECB.
Fig. 3 - Investors adapting to inflation, US...
US average inflation relative to 2% target past decade vs average real yield during current decade, %
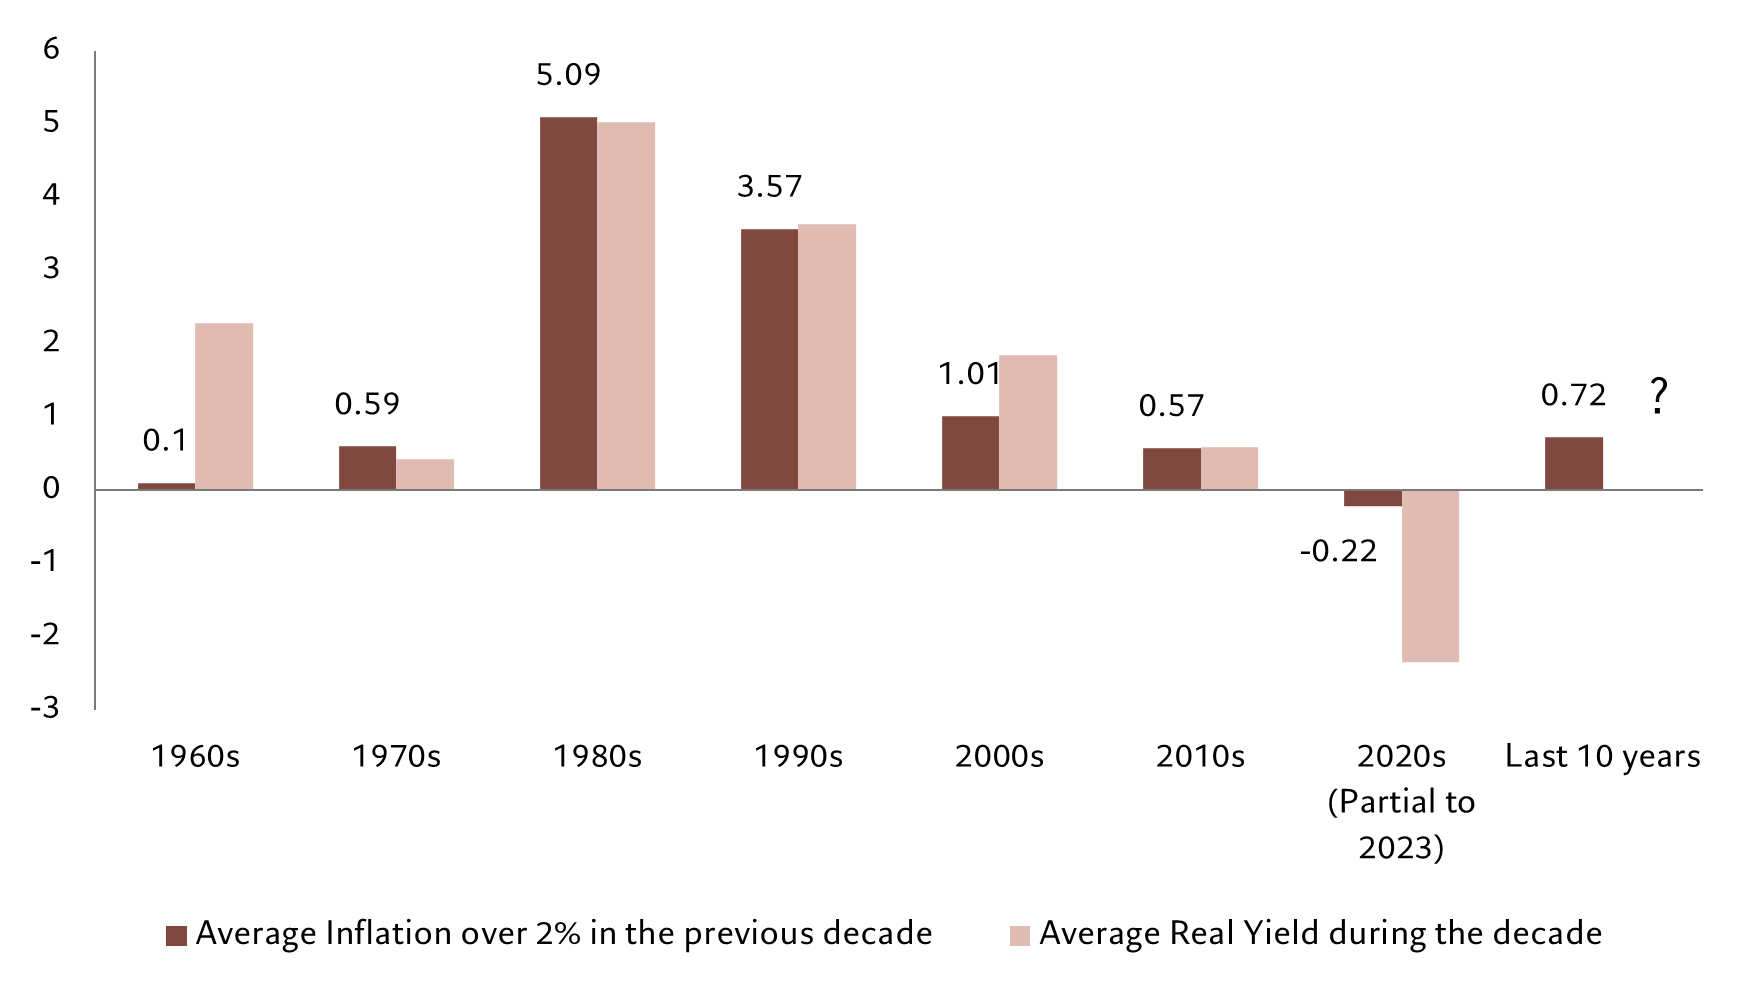
With central banks set to be aiming for positive real rates for a substantial period – in contrast to the decade following the financial crisis of 2008 – yield curves are likely to be, on average, flatter or inverted, rather than upward sloping as they have been during the past 30 years.
As a result, investors will have to manage the duration of their fixed income portfolios much more actively and have less of a bias for long-dated bonds. Given that traditional bond benchmarks have an inherently long bias, this implies a more benchmark agnostic approach.
Fig. 4 - ...and Europe
Euro zone average inflation relative to 2% target past decade vs average real yield during current decade, %
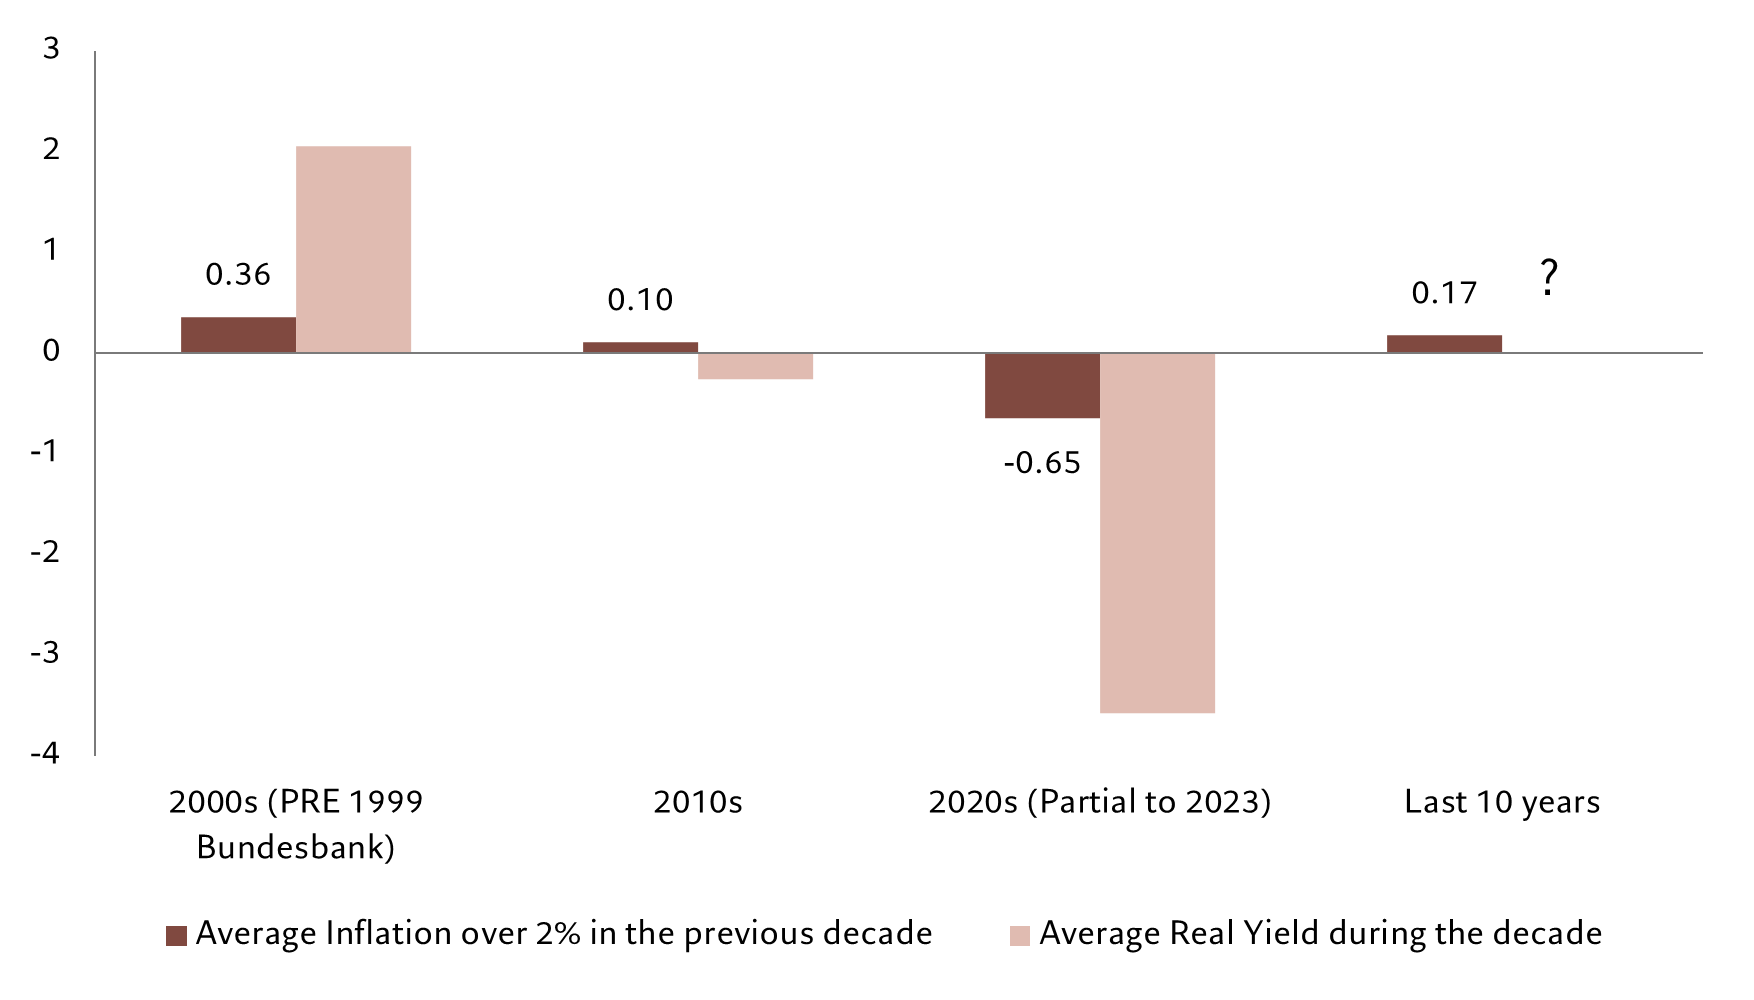
At the same time, investors should also expect an increase in the dispersion of returns across individual markets given central banks’ differing attitudes to inflation. For instance, the Bank of England has been much less rigorous in sticking to its 2 per cent inflation target. This suggests the UK government bond yield curve will be steeper than the US one.
Central banks’ efforts at reconciling weak growth, sticky inflation and activist fiscal policies could well shorten interest rate cycles. They would also tend to lead to higher interest rate volatility than investors grew used to during the past two decades. At the same time, central banks’ experience with quantitative easing could see them use these alternative means of providing liquidity where financial market accidents threaten – think the Credit Suisse and Silicon Valley Bank failures – even as they keep key interest rates at positive real levels.
And because past inflation dictates what level of real yields investors demand in the current period (the lower the inflation then, the lower the real yields expected now), the recent spike in inflation is likely to dominate investor expectations for years to come (see Figs. 3 and 4).
Finally, the further complication of a deteriorating fiscal deficit in the US suggests bond investors need to factor in an additional risk premium. Neither Democrats nor Republicans care much about the state of the government’s finances, so there’s unlikely to be any progress in that direction following the 2024 presidential election.
In light of sticky inflation and fiscal laxness, investors would be wise to add a 0.5 percentage point premium to what they demand from 30-year Treasury bonds above what 10-year Treasuries yield. At the same time, European investors would do well to add a small premium for the risk that the ECB will allow inflation to run slightly hot for a while, suggesting 10-year German bund yields of 3 per cent for the rest of the decade.
related articles

Whether the landing's hard or soft, bonds look good
Yields on government bonds and corporate credits are generous enough to protect investors against considerable market volatility
September 2023

A bond revival beckons in 2024
Bond investors have reasons to be optimistic as the new year approaches.
December 2023
Important legal information
This marketing material is issued by Pictet Asset Management (Europe) S.A.. It is neither directed to, nor intended for distribution or use by, any person or entity who is a citizen or resident of, or domiciled or located in, any locality, state, country or jurisdiction where such distribution, publication, availability or use would be contrary to law or regulation. The latest version of the fund‘s prospectus, Pre-Contractual Template (PCT) when applicable, Key Information Document (KID), annual and semi-annual reports must be read before investing. They are available free of charge in English on www.assetmanagement.pictet or in paper copy at Pictet Asset Management (Europe) S.A., 6B, rue du Fort Niedergruenewald, L-2226 Luxembourg, or at the office of the fund local agent, distributor or centralizing agent if any.
The KID is also available in the local language of each country where the compartment is registered. The prospectus, the PCT when applicable, and the annual and semi-annual reports may also be available in other languages, please refer to the website for other available languages. Only the latest version of these documents may be relied upon as the basis for investment decisions.
The summary of investor rights (in English and in the different languages of our website) is available here and at www.assetmanagement.pictet under the heading "Resources", at the bottom of the page.
The list of countries where the fund is registered can be obtained at all times from Pictet Asset Management (Europe) S.A., which may decide to terminate the arrangements made for the marketing of the fund or compartments of the fund in any given country.
The information and data presented in this document are not to be considered as an offer or solicitation to buy, sell or subscribe to any securities or financial instruments or services.
Information, opinions and estimates contained in this document reflect a judgment at the original date of publication and are subject to change without notice. The management company has not taken any steps to ensure that the securities referred to in this document are suitable for any particular investor and this document is not to be relied upon in substitution for the exercise of independent judgment. Tax treatment depends on the individual circumstances of each investor and may be subject to change in the future. Before making any investment decision, investors are recommended to ascertain if this investment is suitable for them in light of their financial knowledge and experience, investment goals and financial situation, or to obtain specific advice from an industry professional.
The value and income of any of the securities or financial instruments mentioned in this document may fall as well as rise and, as a consequence, investors may receive back less than originally invested.
The investment guidelines are internal guidelines which are subject to change at any time and without any notice within the limits of the fund's prospectus. The mentioned financial instruments are provided for illustrative purposes only and shall not be considered as a direct offering, investment recommendation or investment advice. Reference to a specific security is not a recommendation to buy or sell that security. Effective allocations are subject to change and may have changed since the date of the marketing material.
Past performance is not a guarantee or a reliable indicator of future performance. Performance data does not include the commissions and fees charged at the time of subscribing for or redeeming shares.
Any index data referenced herein remains the property of the Data Vendor. Data Vendor Disclaimers are available on assetmanagement.pictet in the “Resources” section of the footer. This document is a marketing communication issued by Pictet Asset Management and is not in scope for any MiFID II/MiFIR requirements specifically related to investment research. This material does not contain sufficient information to support an investment decision and it should not be relied upon by you in evaluating the merits of investing in any products or services offered or distributed by Pictet Asset Management.
Pictet AM has not acquired any rights or license to reproduce the trademarks, logos or images set out in this document except that it holds the rights to use any entity of the Pictet group trademarks. For illustrative purposes only.